eORCA025.L121-OPM021
Summary
Compare to eORCA025.L121-OPM020, we change the icb distribution (stern et al. 2016) and some sea ice parameters (drag and snow conductivity) based on Katherine simulation.
Namelist
Only the change compare to the reference (eORCA025.L121-OPM020) a mentioned in the next sections.
Full files are available here: https://github.com/pmathiot/NEMOCFG/tree/main/cfgs/eORCA025.L121-OPM021/cfgs/eORCA025.L121-OPM021/EXPREF
namelist_ice
namdyn_rhg
the simulation do not use the aevp rheology, and only iterate 100 times instead of 120 times.
!------------------------------------------------------------------------------
&namdyn_rhg     !   Ice rheology
!------------------------------------------------------------------------------
   ln_rhg_EVP       = .true.          !  EVP rheology
      ln_aEVP       = .false.          !     adaptive rheology (Kimmritz et al. 2016 & 2017)
      rn_creepl     =   2.0e-9        !     creep limit [1/s]
      rn_ecc        =   2.0           !     eccentricity of the elliptical yield curve
      nn_nevp       = 120             !     number of EVP subcycles
      rn_relast     =   0.333         !     ratio of elastic timescale to ice time step: Telast = dt_ice * rn_relast
                                      !        advised value: 1/3 (nn_nevp=100) or 1/9 (nn_nevp=300)
   nn_rhg_chkcvg    =   0             !  check convergence of rheology
                                      !     = 0  no check
                                      !     = 1  check at the main time step (output xml: uice_cvg)
                                      !     = 2  check at both main and rheology time steps (additional output: ice_cvg.nc)
                                      !          this option 2 asks a lot of communications between cpu
/
namsbc
the ice-ocean drag is set to 5e-3 instead of 12e-3
!------------------------------------------------------------------------------
&namsbc         !   Ice surface boundary conditions
!------------------------------------------------------------------------------
   rn_cio           =   5.0e-03       !  ice-ocean drag coefficient (-)
   nn_snwfra        =   2             !  calculate the fraction of ice covered by snow (for zdf and albedo)
                                      !     = 0  fraction = 1 (if snow) or 0 (if no snow)
                                      !     = 1  fraction = 1-exp(-0.2*rhos*hsnw) [MetO formulation]
                                      !     = 2  fraction = hsnw / (hsnw+0.02)    [CICE formulation]
   rn_snwblow       =   0.66          !  mesure of snow blowing into the leads
                                      !     = 1 => no snow blowing, < 1 => some snow blowing
   nn_flxdist       =  -1             !  Redistribute heat flux over ice categories
                                      !     =-1  Do nothing (needs N(cat) fluxes)
                                      !     = 0  Average N(cat) fluxes then apply the average over the N(cat) ice
                                      !     = 1  Average N(cat) fluxes then redistribute over the N(cat) ice using T-ice and albedo sensitivity
                                      !     = 2  Redistribute a single flux over categories
   ln_cndflx        = .false.         !  Use conduction flux as surface boundary conditions (i.e. for Jules coupling)
      ln_cndemulate = .false.         !     emulate conduction flux (if not provided in the inputs)
   nn_qtrice        =   1             !  Solar flux transmitted thru the surface scattering layer:
                                      !     = 0  Grenfell and Maykut 1977 (depends on cloudiness and is 0 when there is snow)
                                      !     = 1  Lebrun 2019 (equals 0.3 anytime with different melting/dry snw conductivities)
/
namthd_zdf
the snow conductivity is increased from 0.31 to 0.35
!------------------------------------------------------------------------------
&namthd_zdf     !   Ice heat diffusion
!------------------------------------------------------------------------------
   ln_zdf_BL99      = .true.          !  Heat diffusion follows Bitz and Lipscomb 1999
   ln_cndi_U64      = .false.         !  sea ice thermal conductivity: k = k0 + beta.S/T            (Untersteiner, 1964)
   ln_cndi_P07      = .true.          !  sea ice thermal conductivity: k = k0 + beta1.S/T - beta2.T (Pringle et al., 2007)
   rn_cnd_s         =   0.35          !  thermal conductivity of the snow (0.31 W/m/K, Maykut and Untersteiner, 1971)
                                      !     Obs: 0.1-0.5 (Lecomte et al, JAMES 2013)
   rn_kappa_i       =   1.0           !  radiation attenuation coefficient in sea ice                     [1/m]
   rn_kappa_s       =  10.0           !  nn_qtrice = 0: radiation attenuation coefficient in snow         [1/m]
   rn_kappa_smlt    =   7.0           !  nn_qtrice = 1: radiation attenuation coefficient in melting snow [1/m]
   rn_kappa_sdry    =  10.0           !                 radiation attenuation coefficient in dry snow     [1/m]
   ln_zdf_chkcvg    = .false.         !  check convergence of heat diffusion scheme (outputs: tice_cvgerr, tice_cvgstp)
/
namthd_do
the frazil ice parametrization is turned off
!------------------------------------------------------------------------------
&namthd_do      !   Ice growth in open water
!------------------------------------------------------------------------------
   rn_hinew         =   0.1           !  thickness for new ice formation in open water (m), must be larger than rn_himin
   ln_frazil        = .false.          !  Frazil ice parameterization (ice collection as a function of wind)
      rn_maxfraz    =   1.0           !     maximum fraction of frazil ice collecting at the ice base
      rn_vfraz      =   0.417         !     thresold drift speed for frazil ice collecting at the ice bottom (m/s)
      rn_Cfraz      =   5.0           !     squeezing coefficient for frazil ice collecting at the ice bottom
/
Monitoring
Global indicators
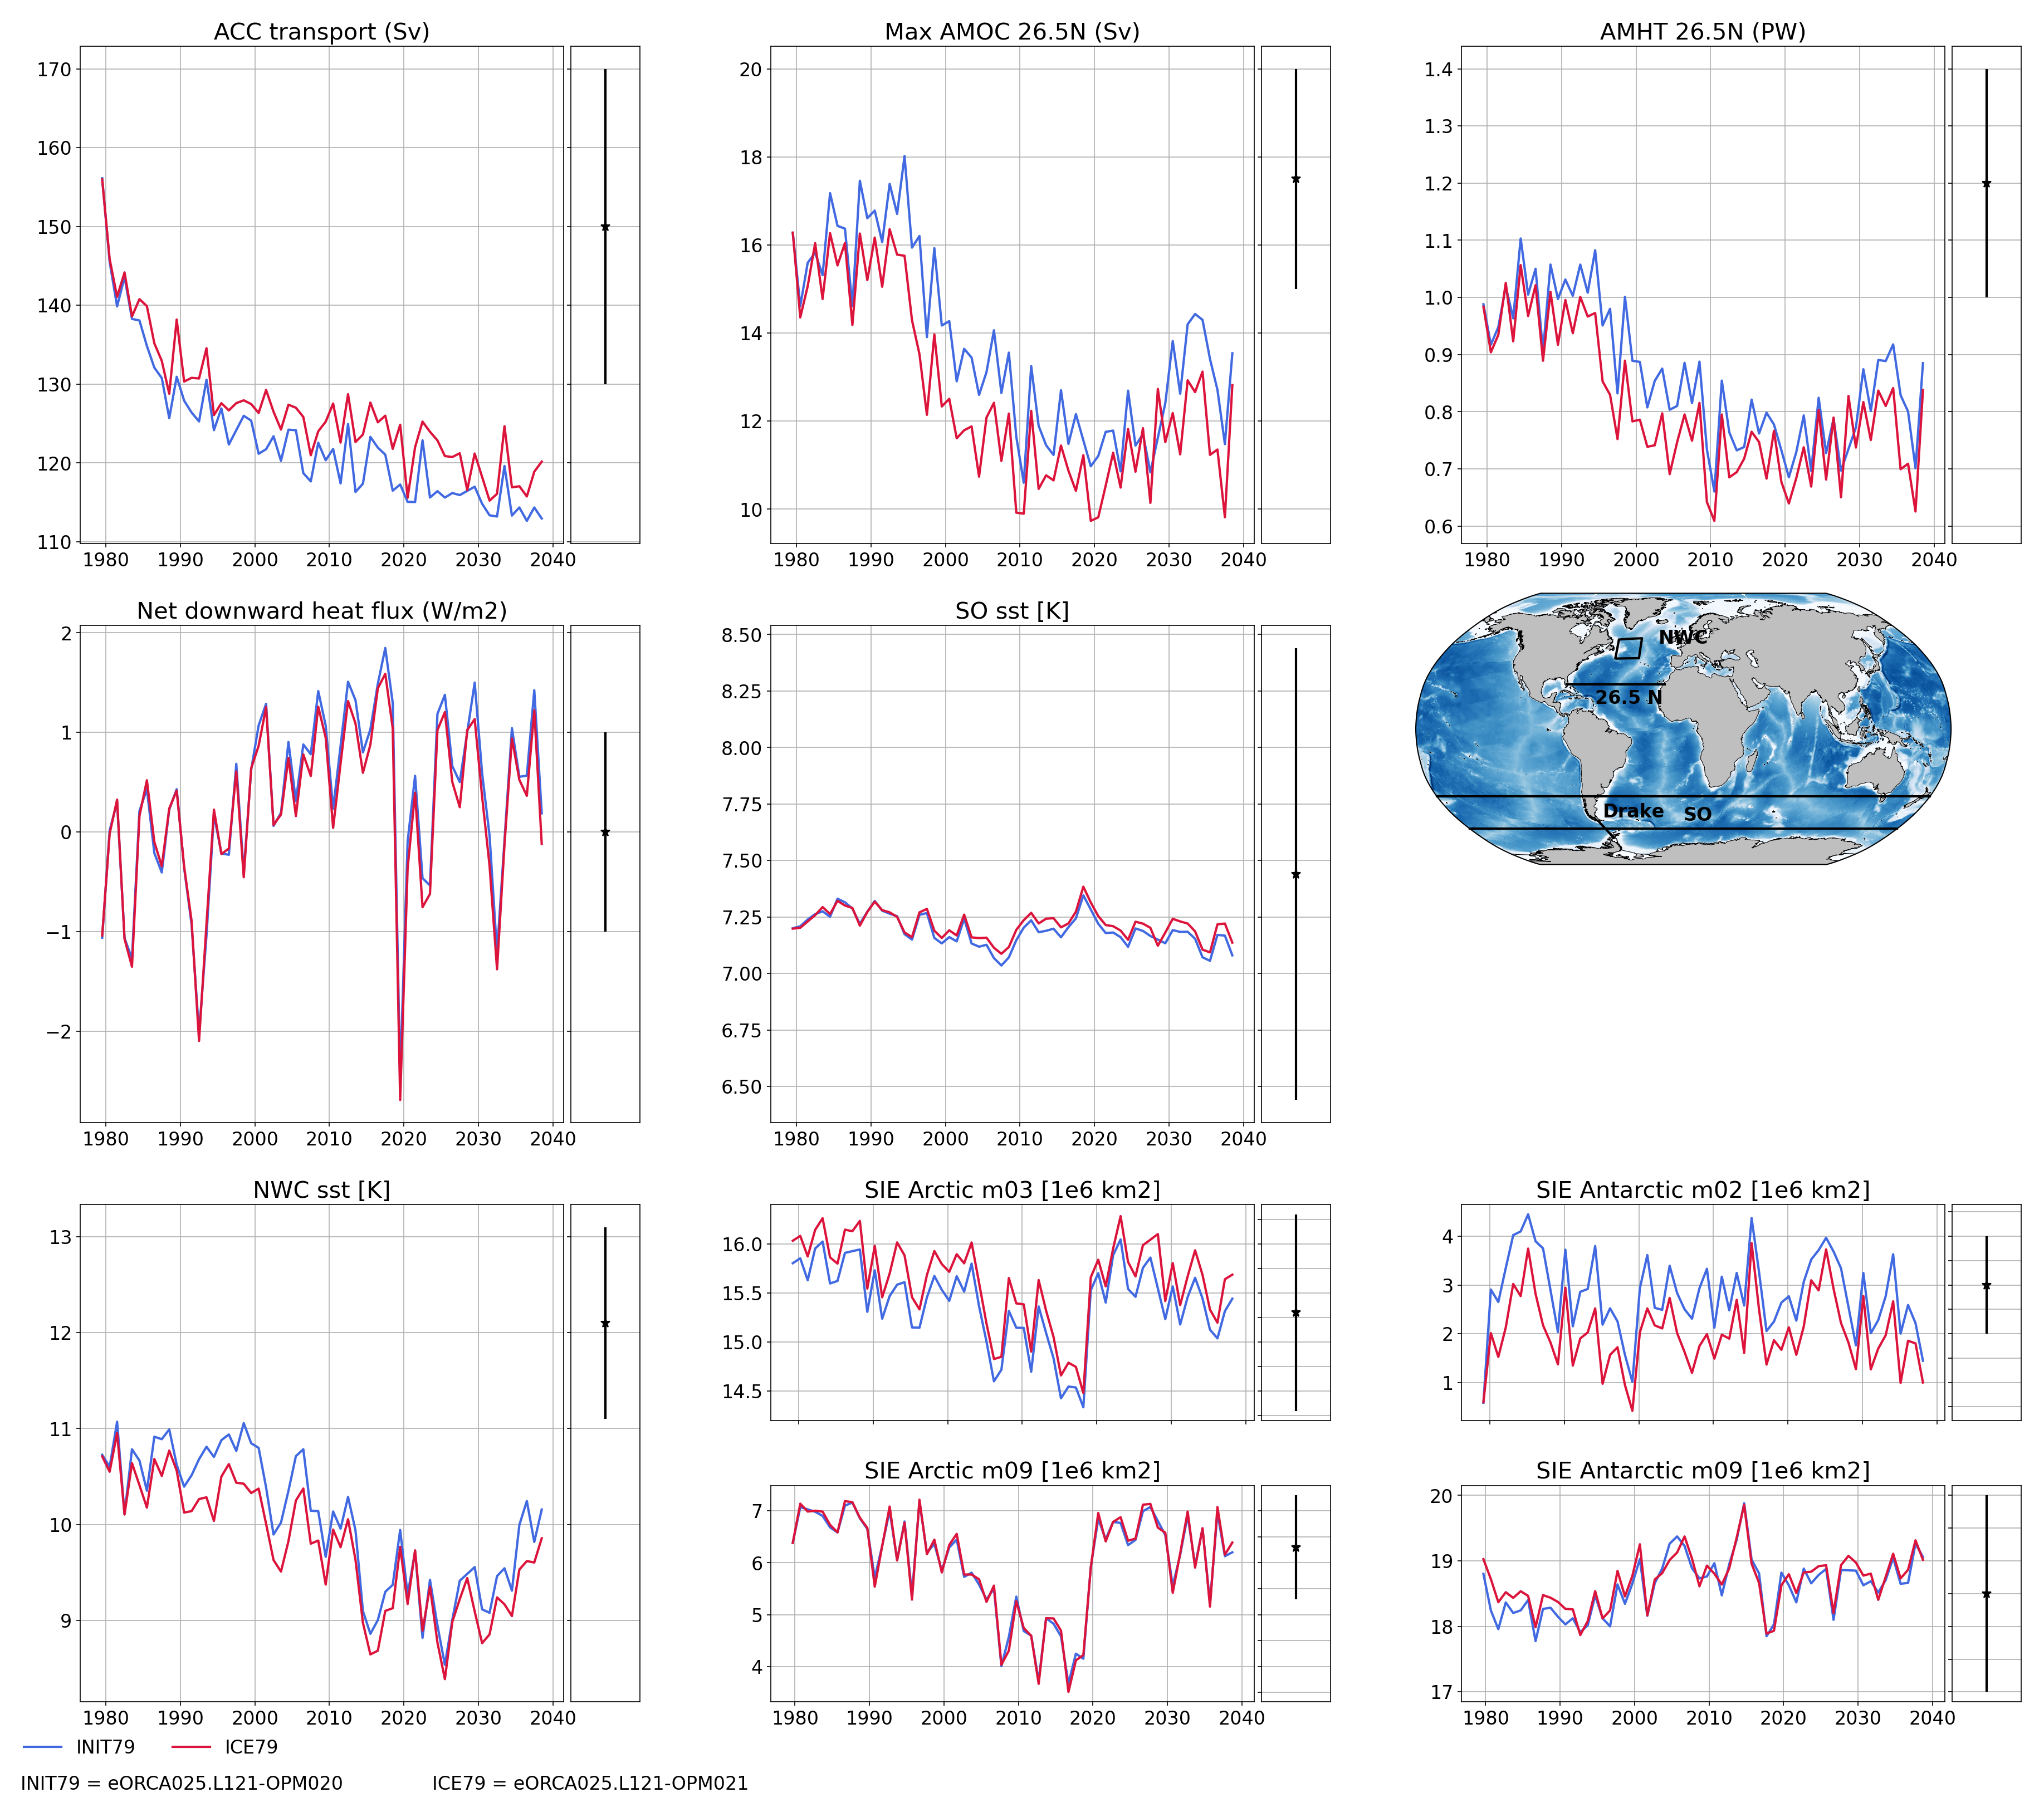
On these plot you can find a time series of:
ACC transport
AMOC at rapid array
AMHT at rapid array
Net global heat fluxes
mean sst in the southern ocean (see box in the map)
mean sst in the North West Corner (see box in the map)
sea ice extent (arctic/ant in summer/winter)
Regional indicators
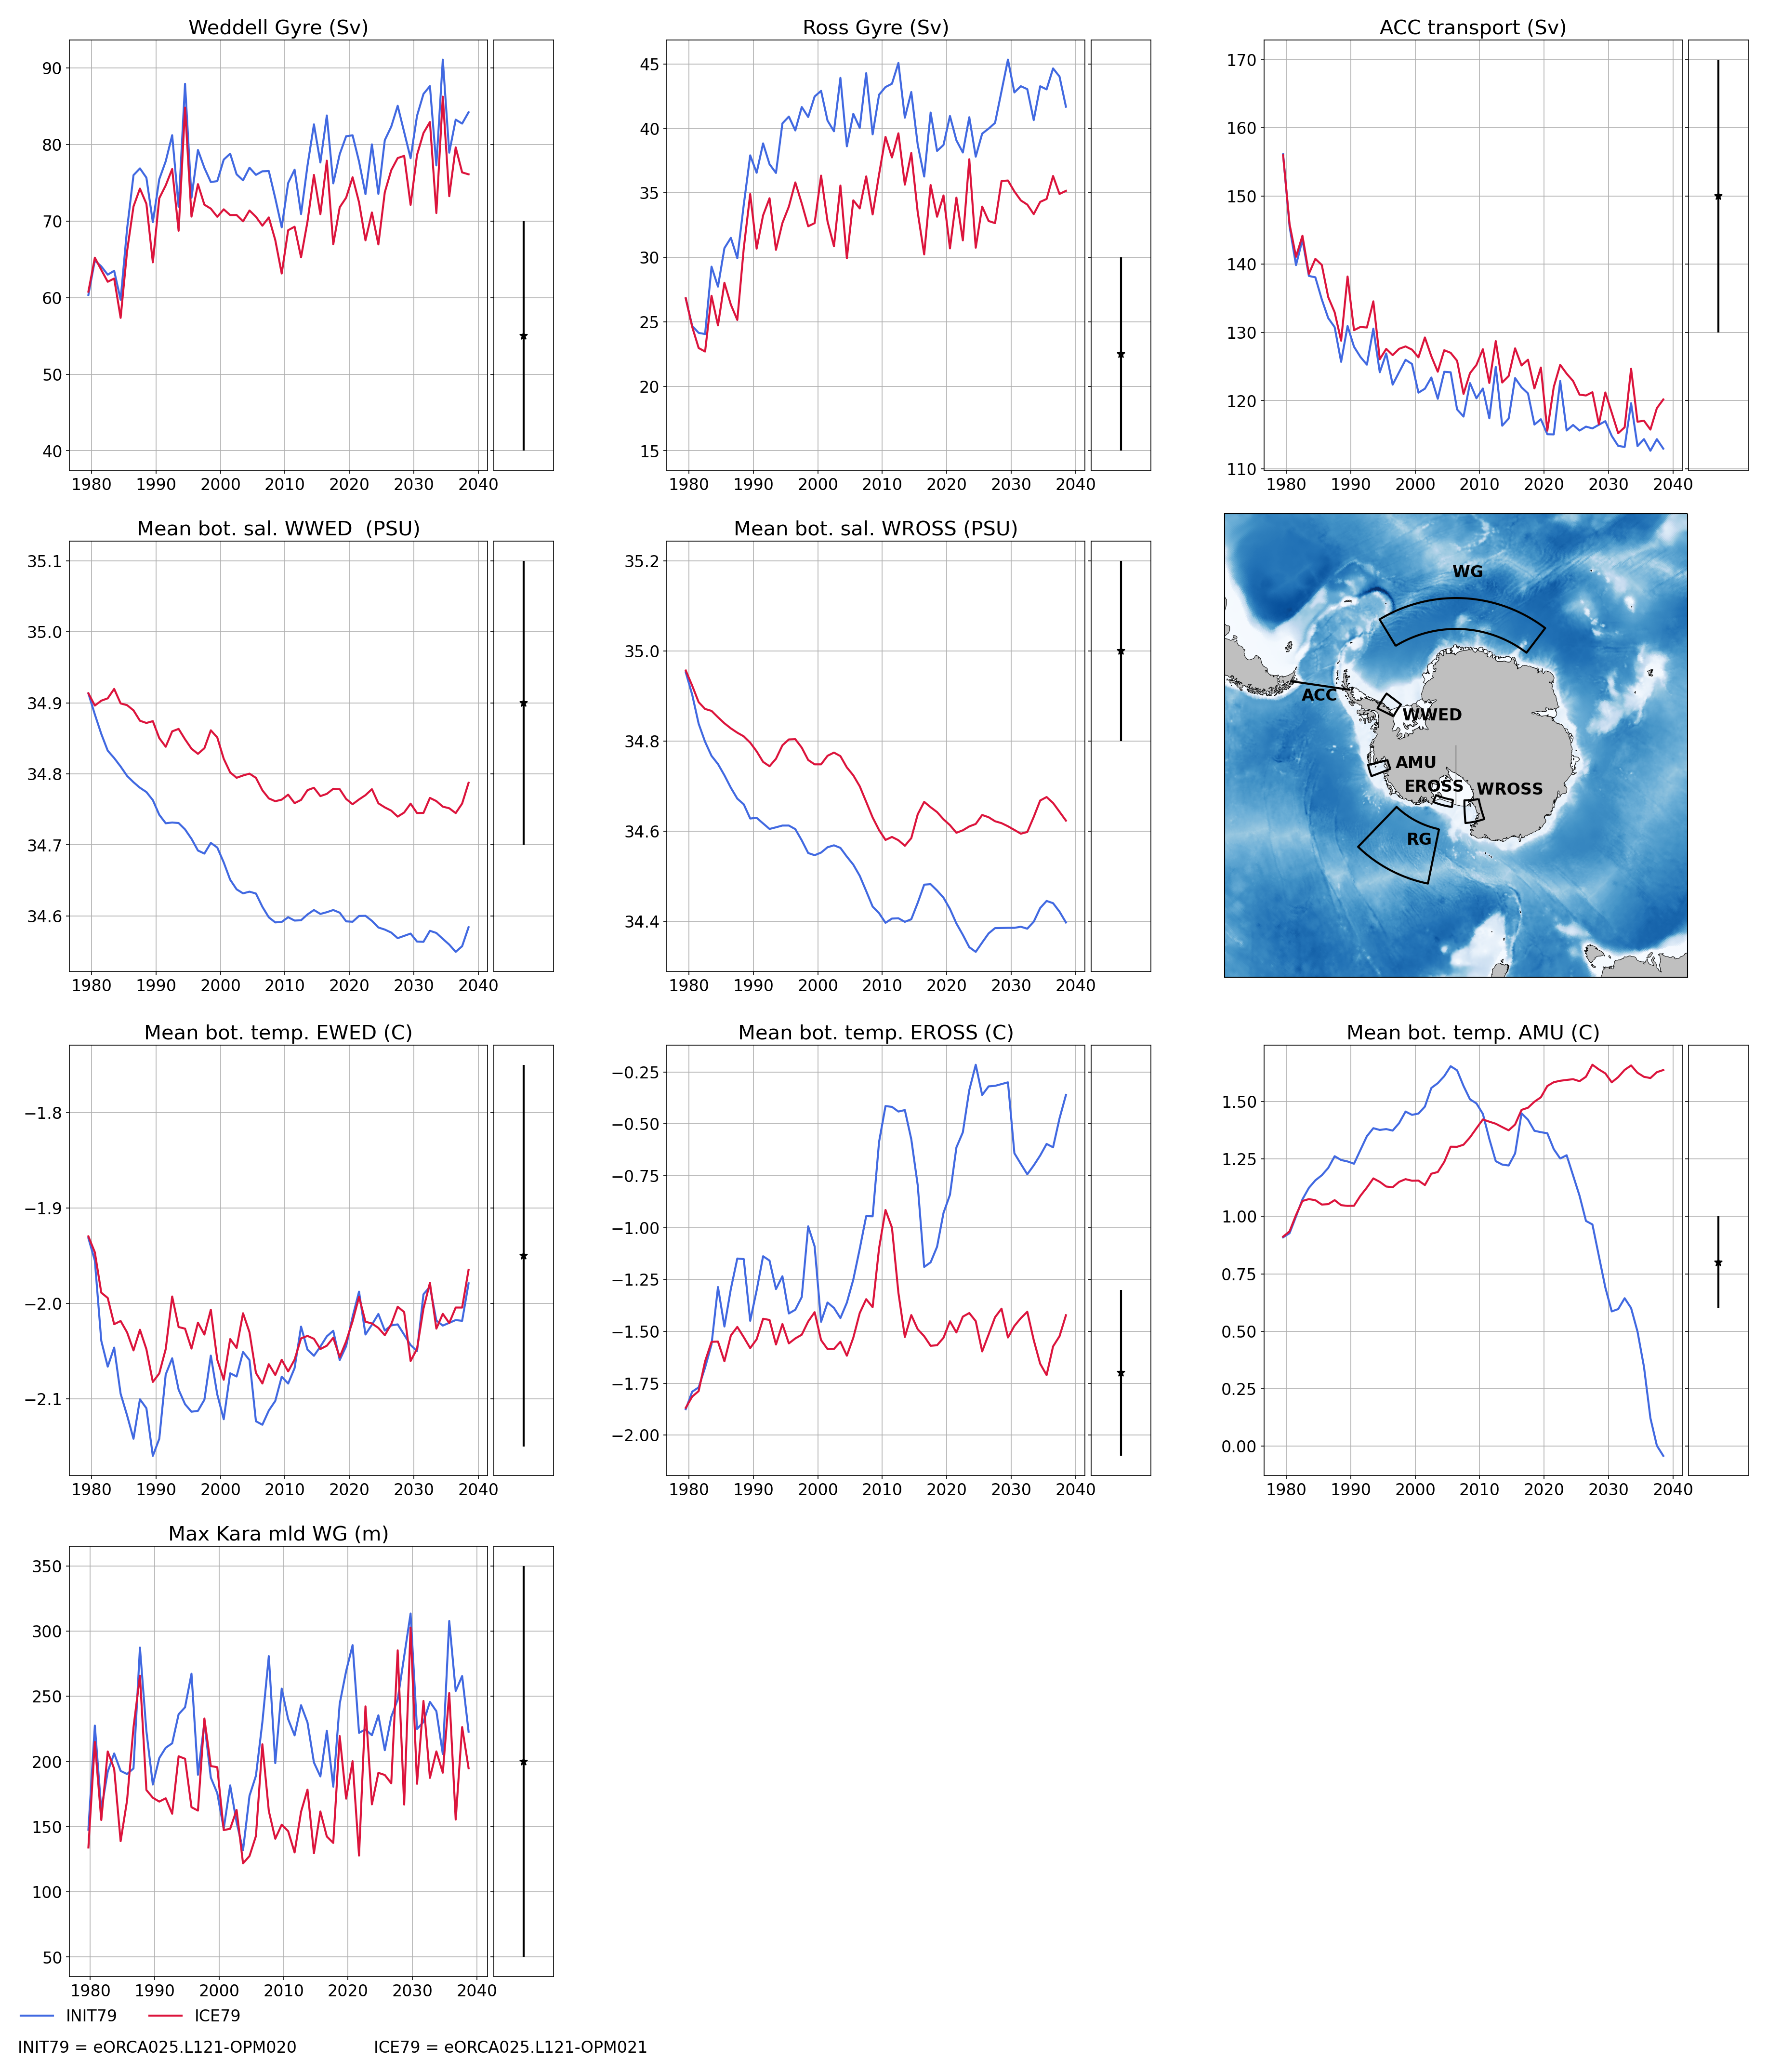
On these plot, you can find time series of:
ACC transport
Maximum of the Weddell and Ross Gyre (box where the max compute show in the map)
Mean bottom salinity over the main dense water formation hot spot (West Ross and West FRIS)
Mean bottom temperature over East Ross and Amudsen sea to monitor CDW intrusion
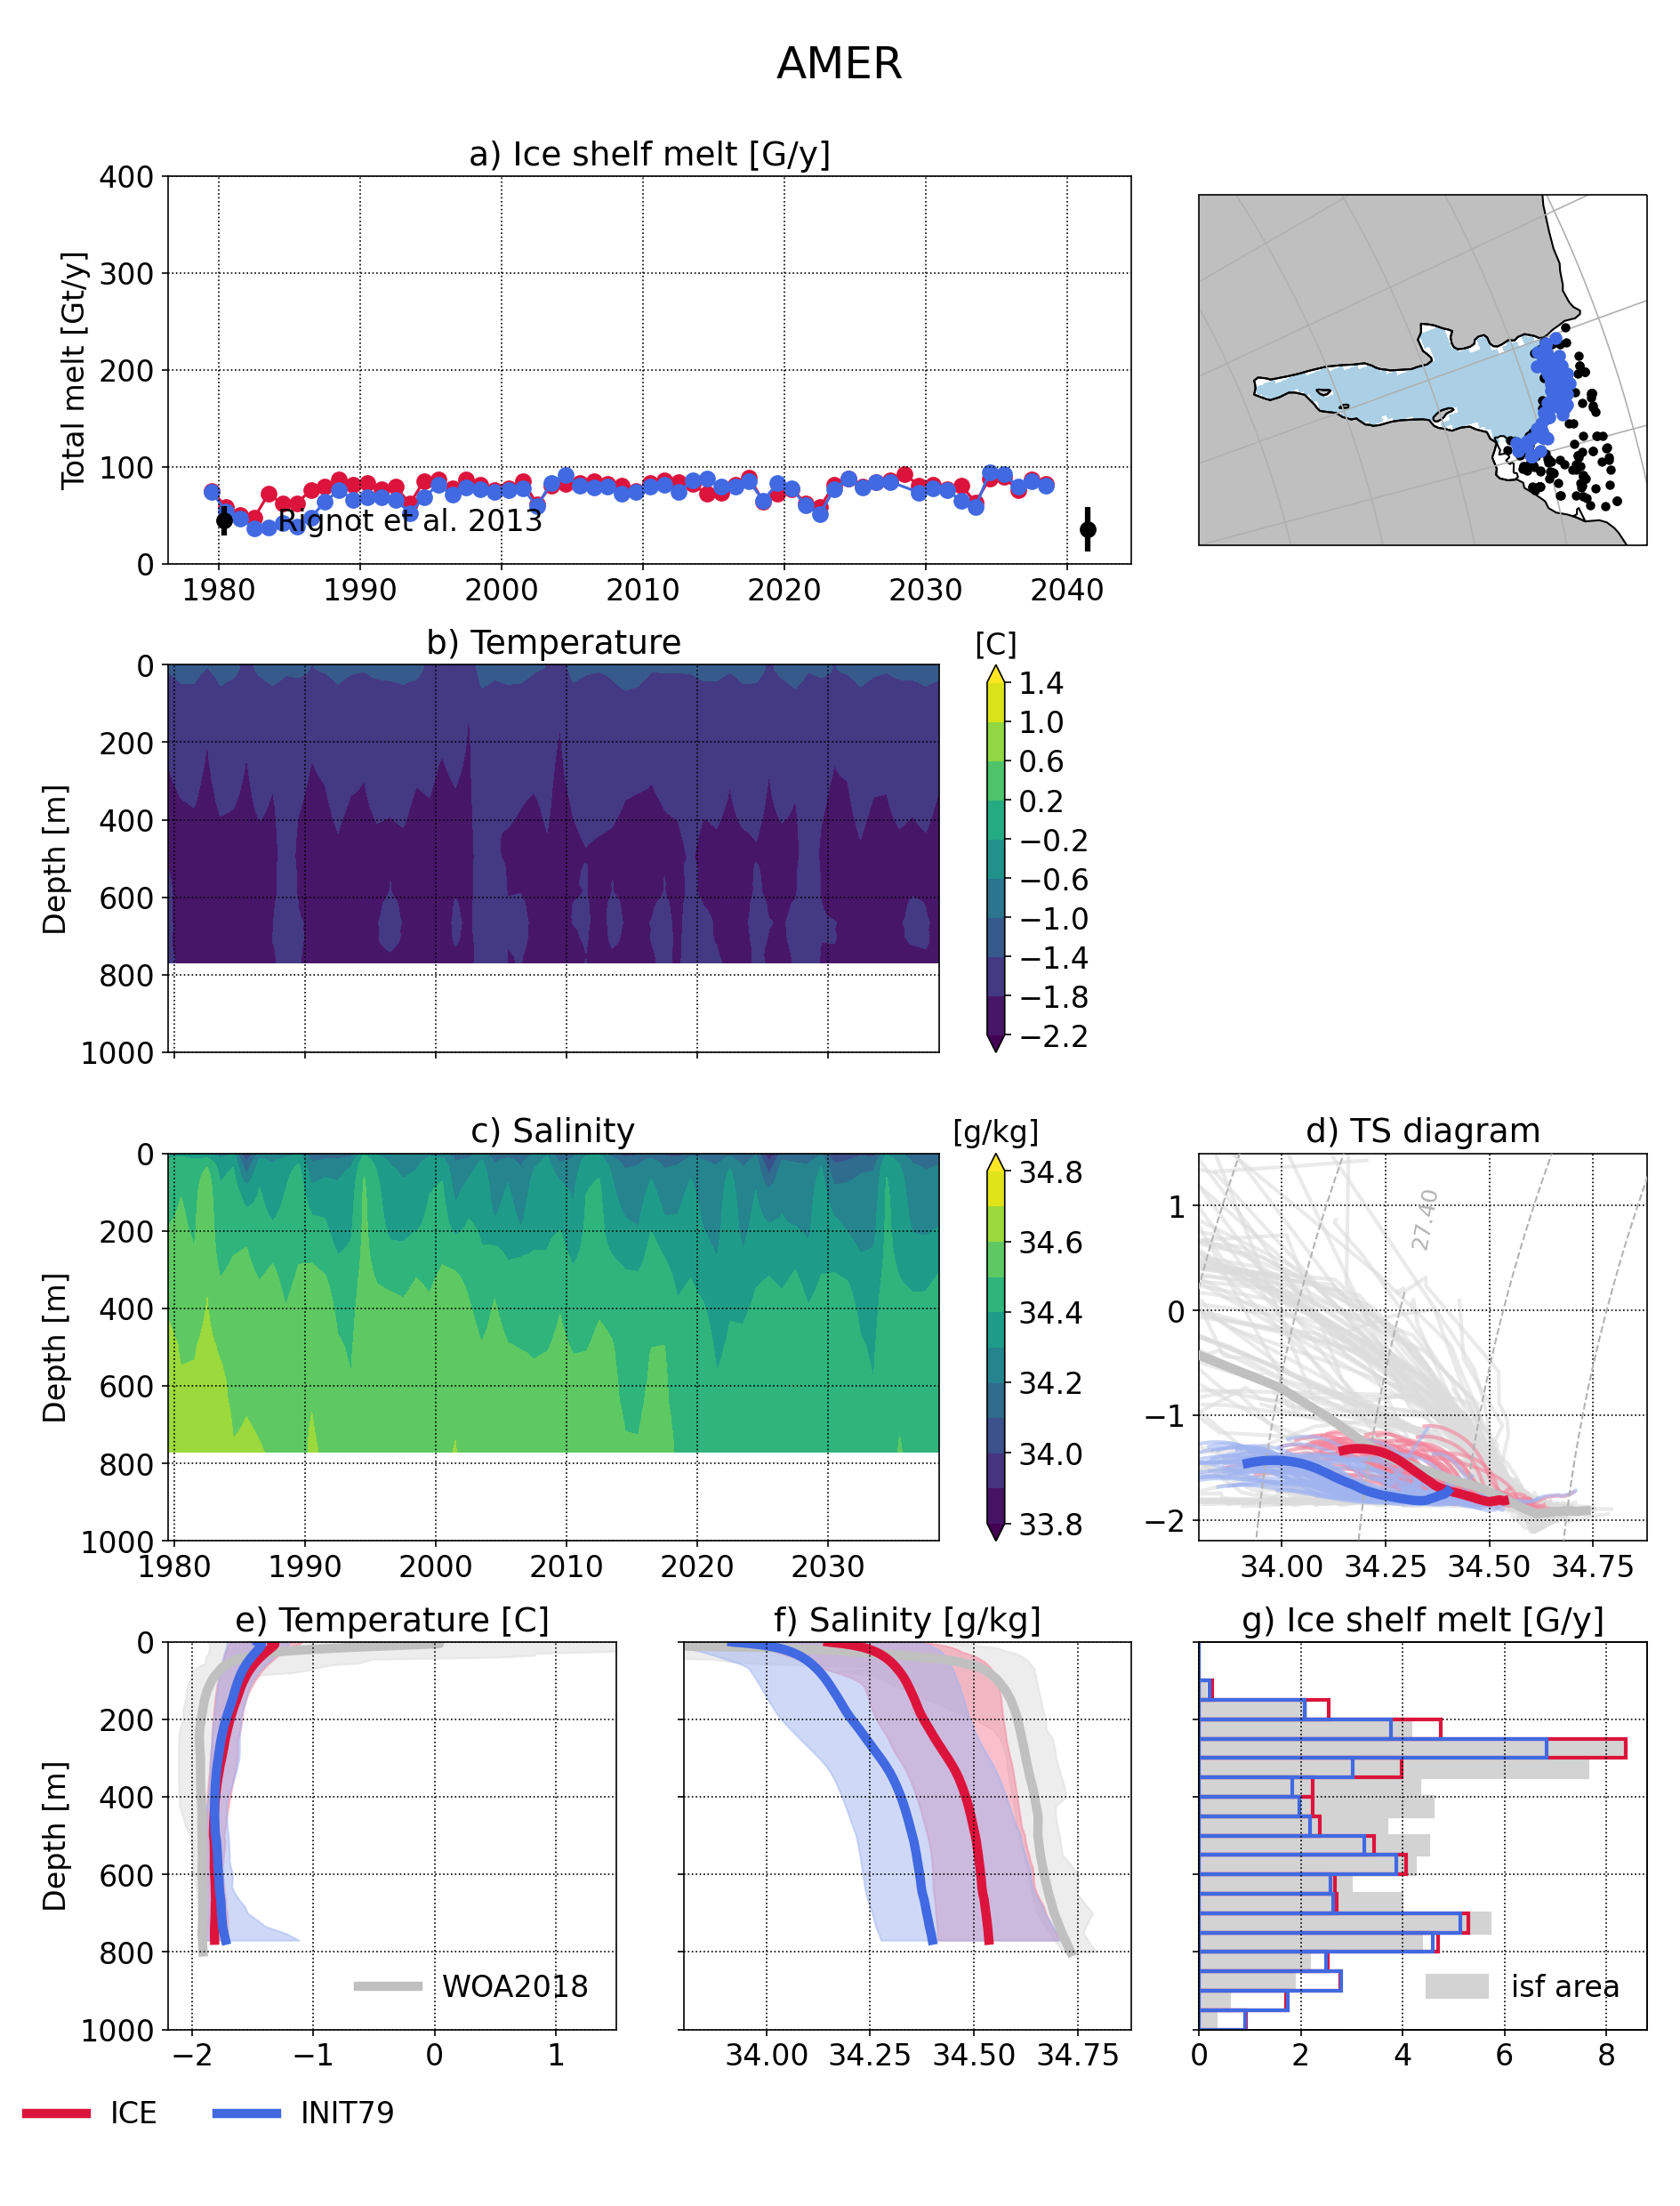
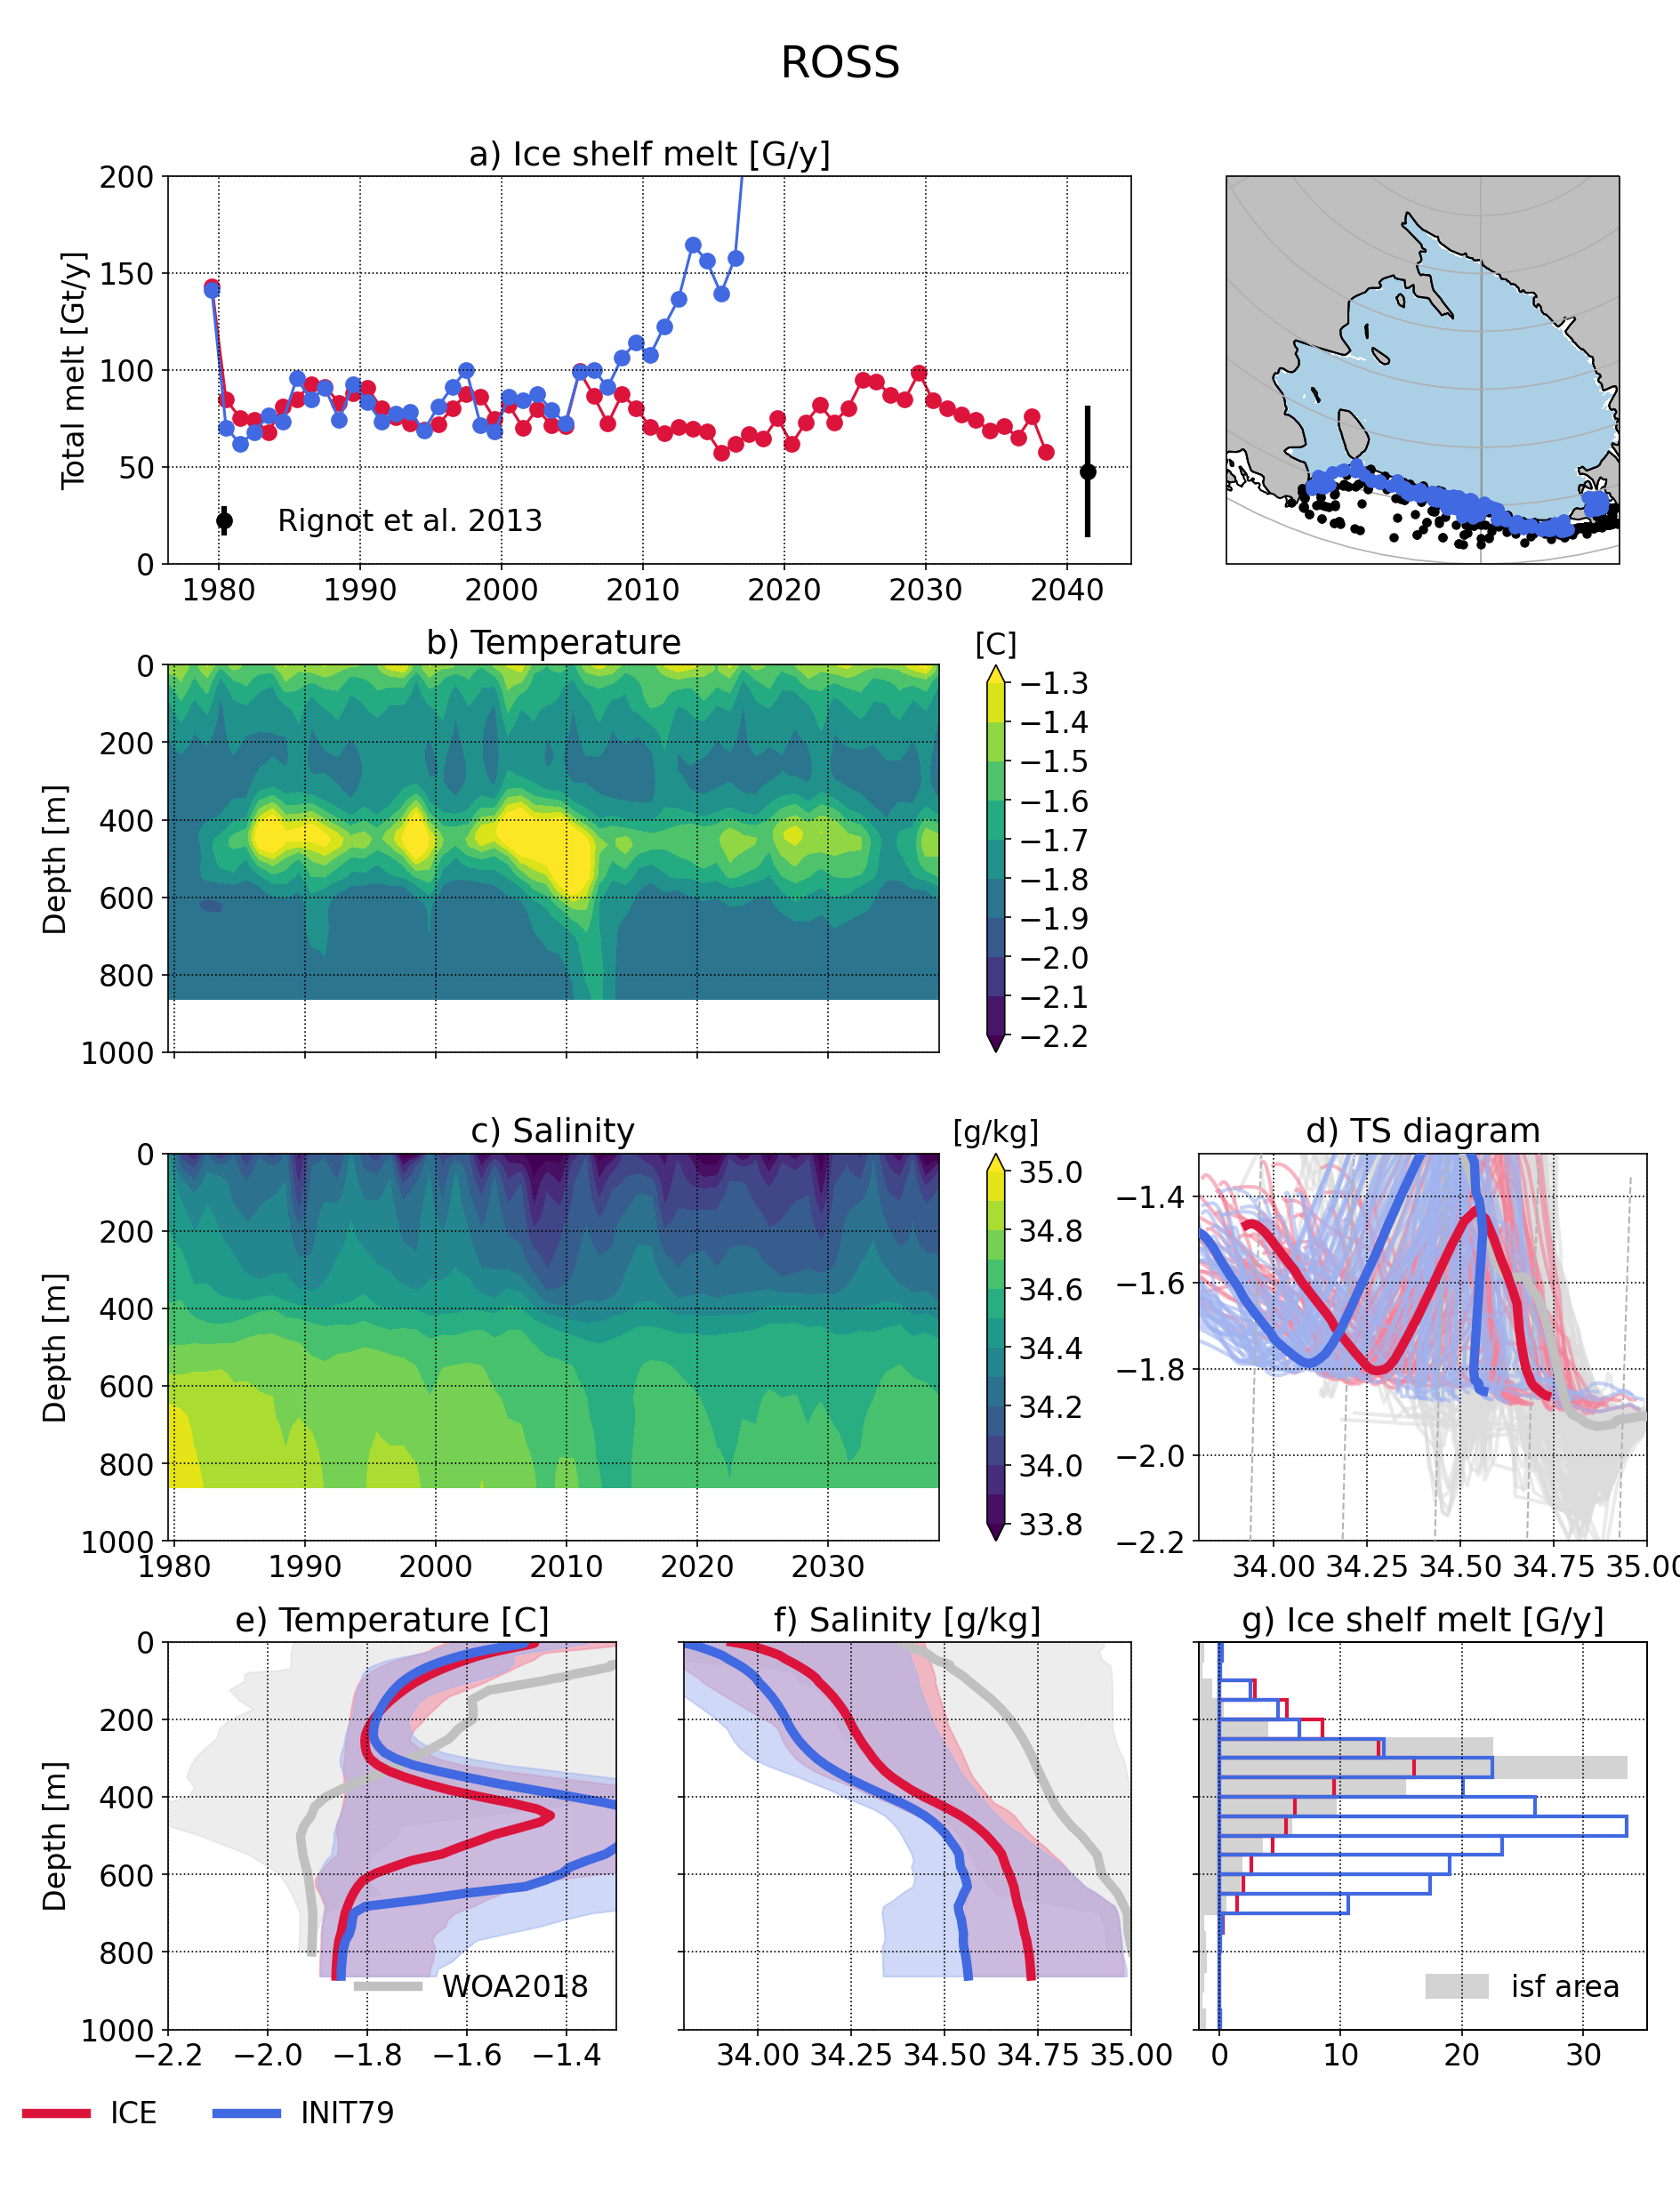
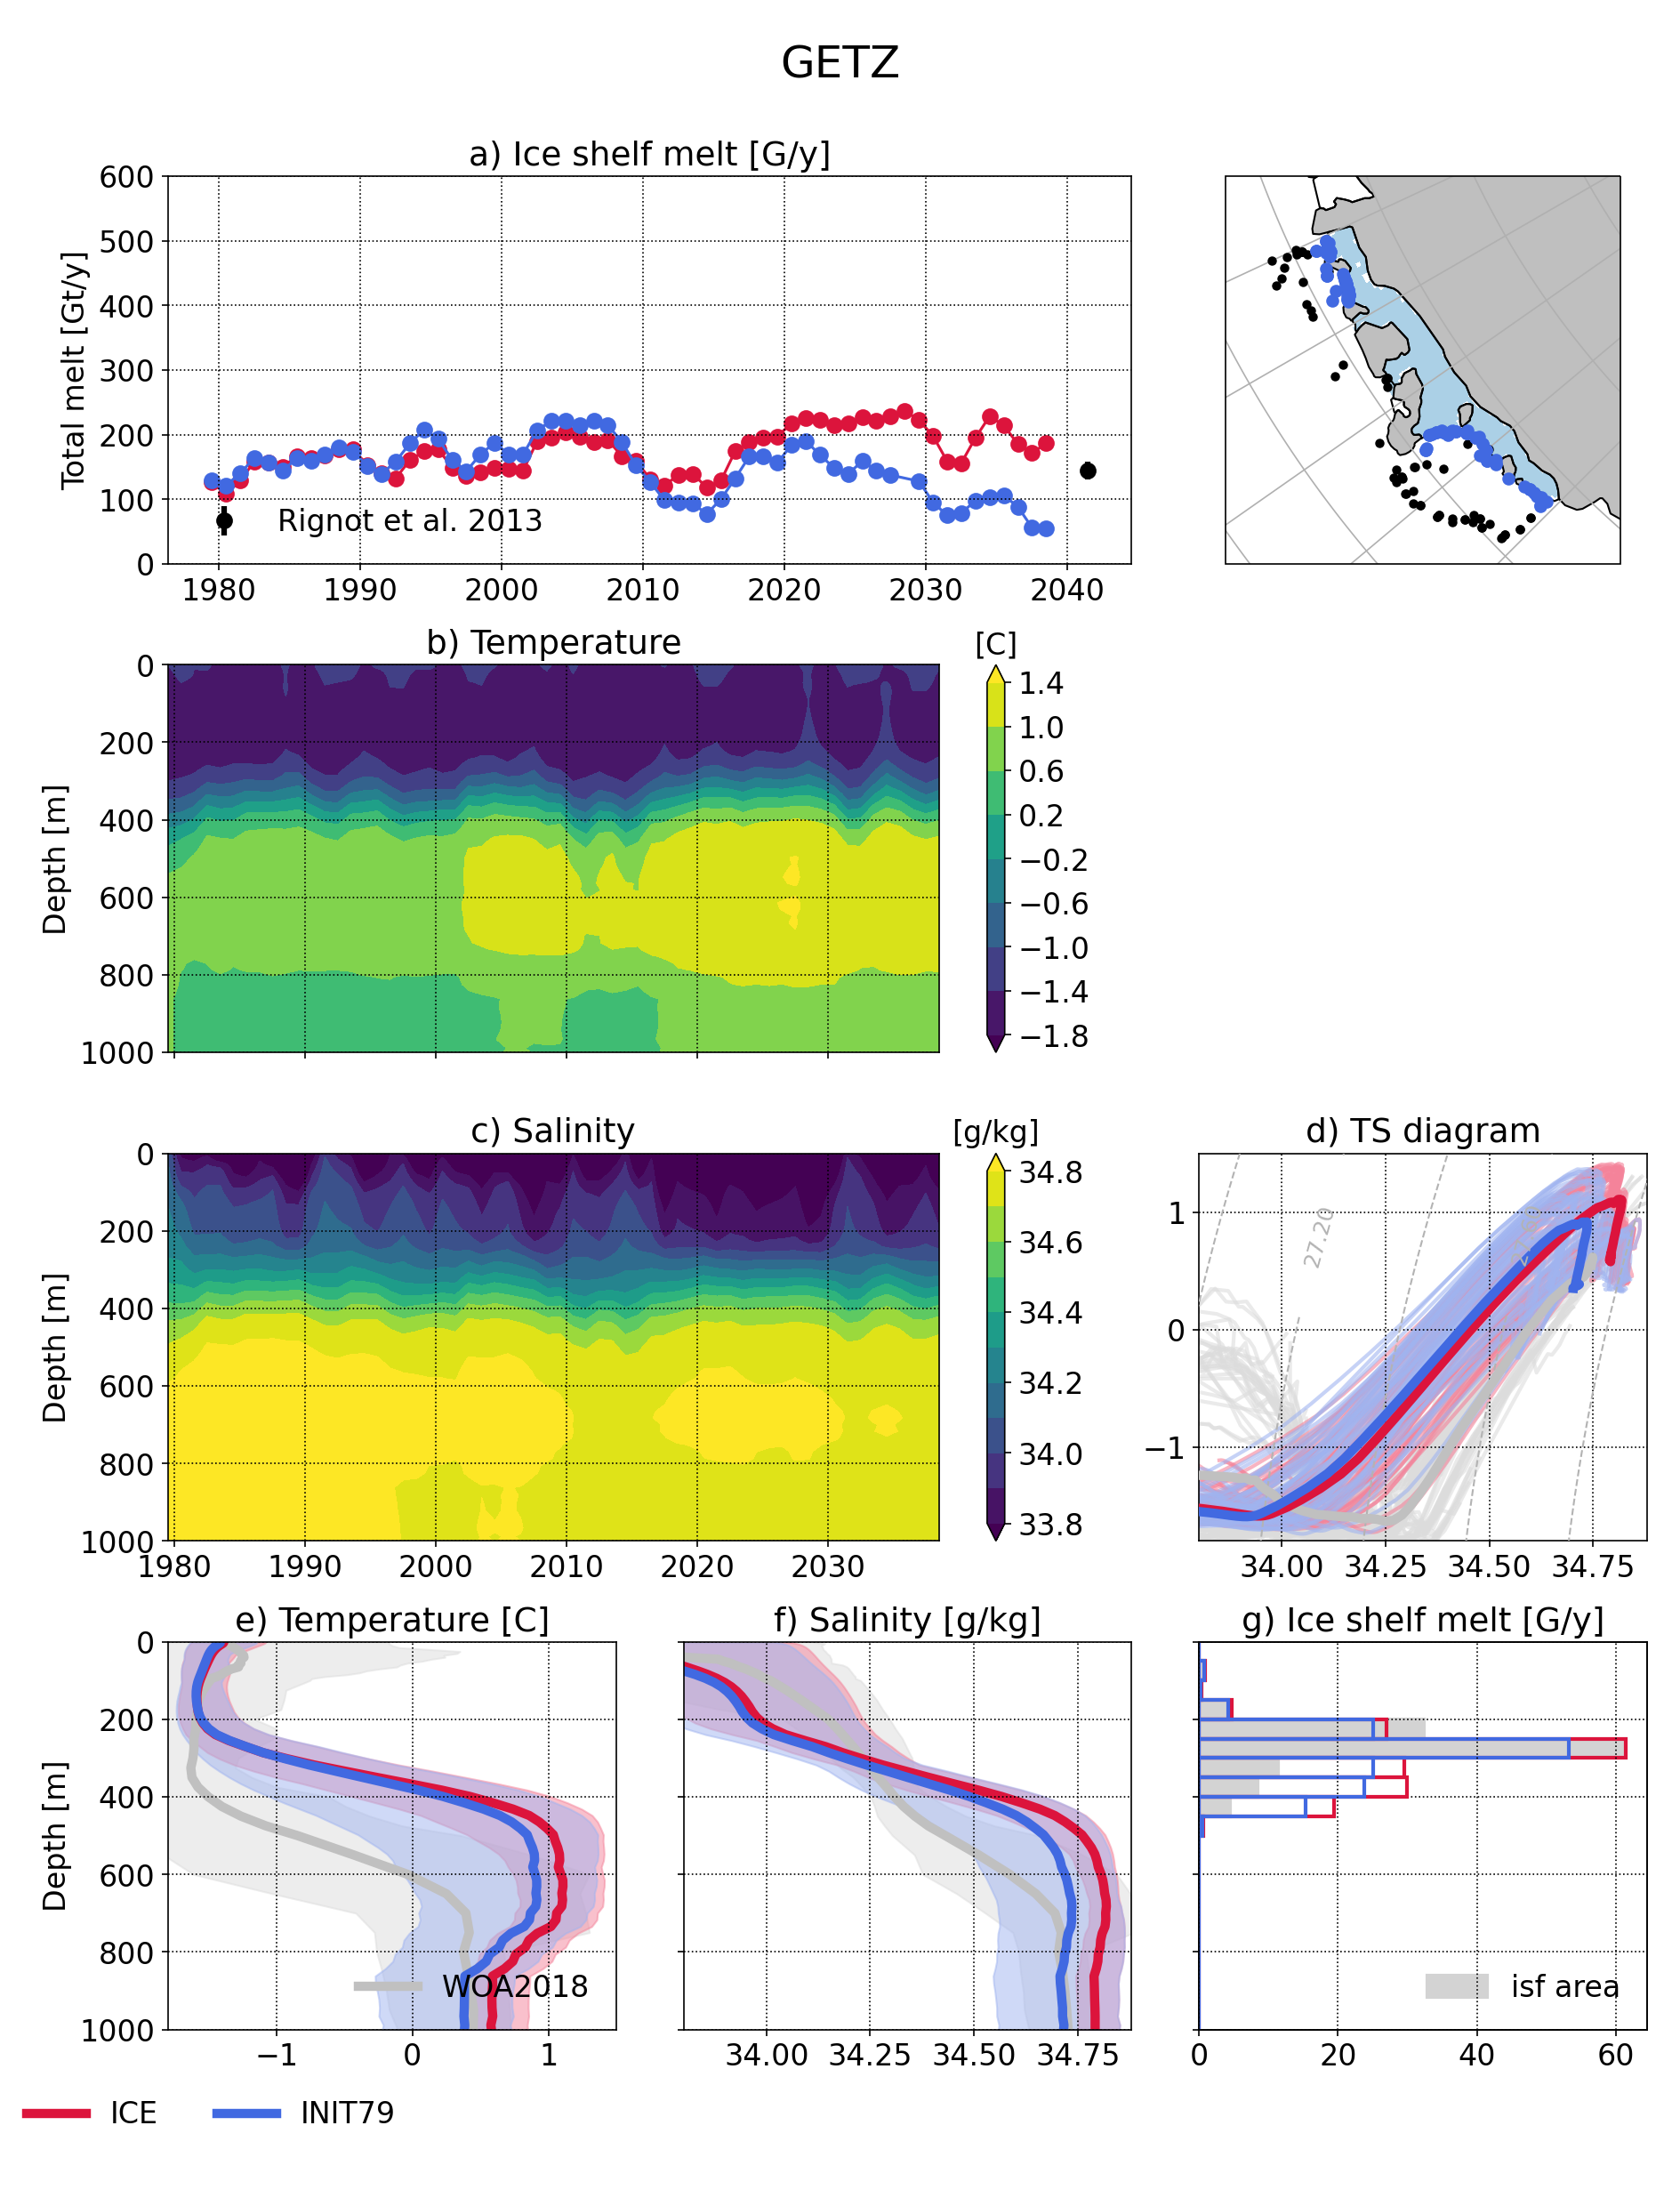
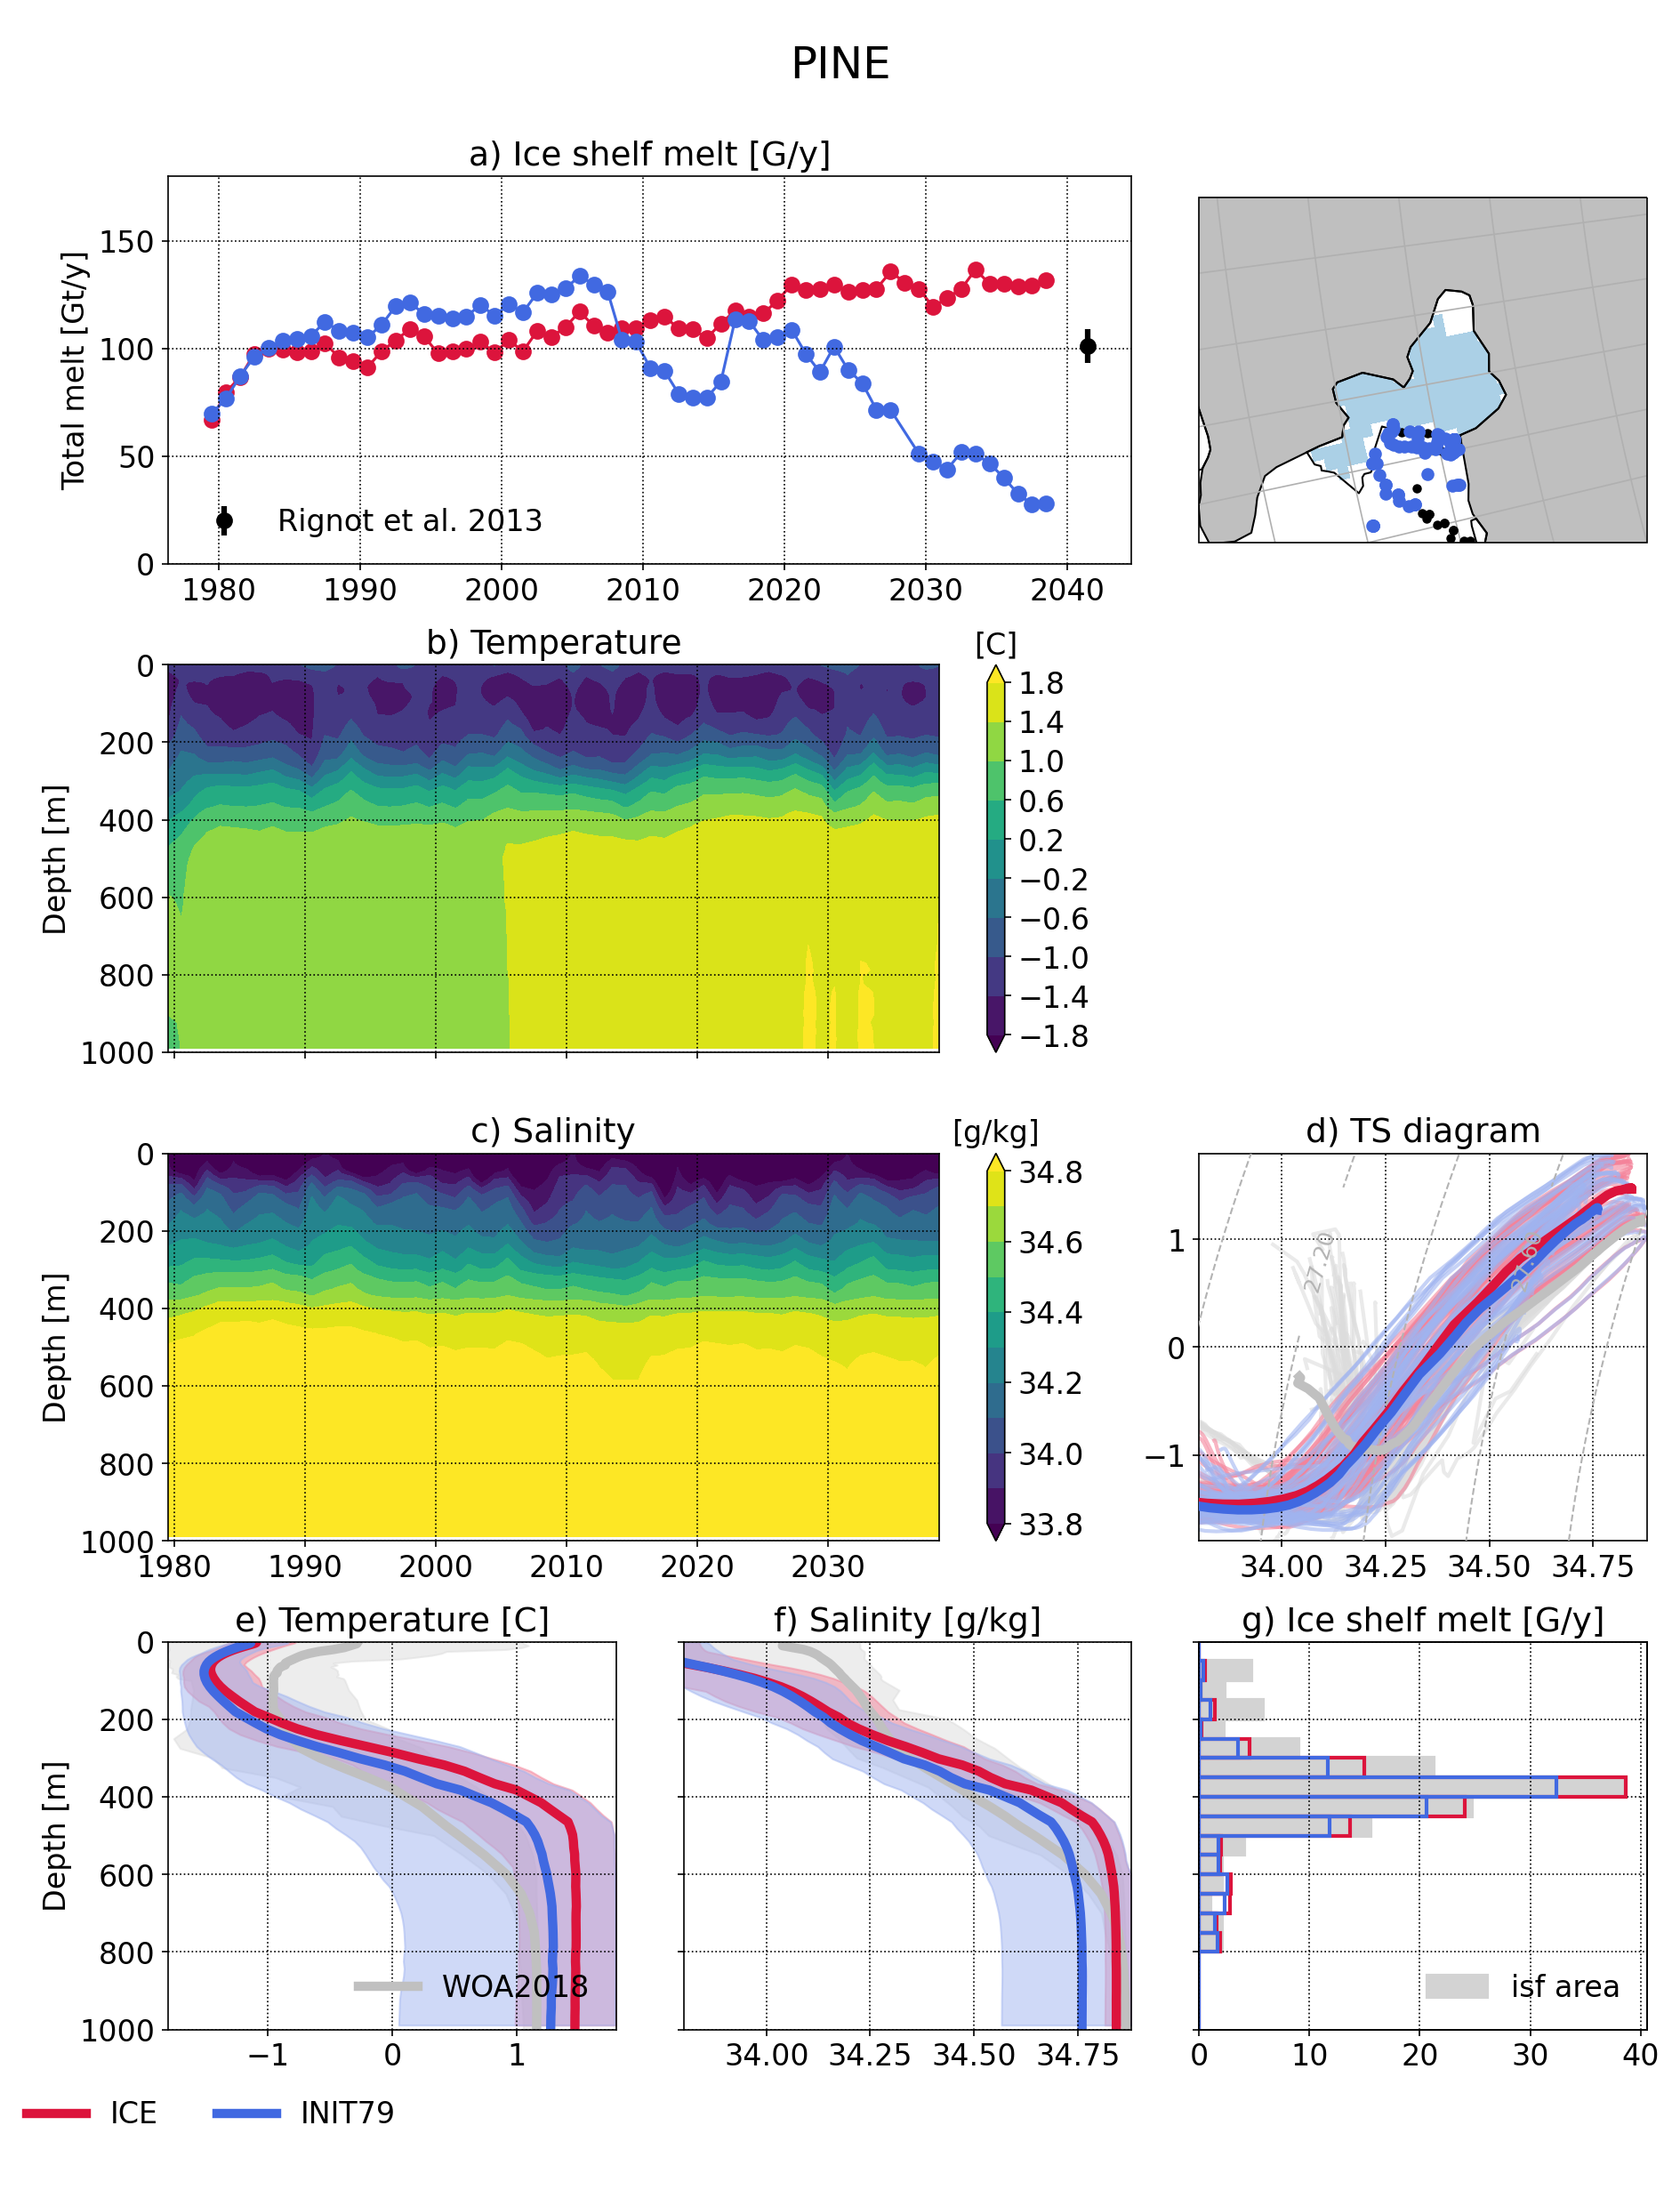
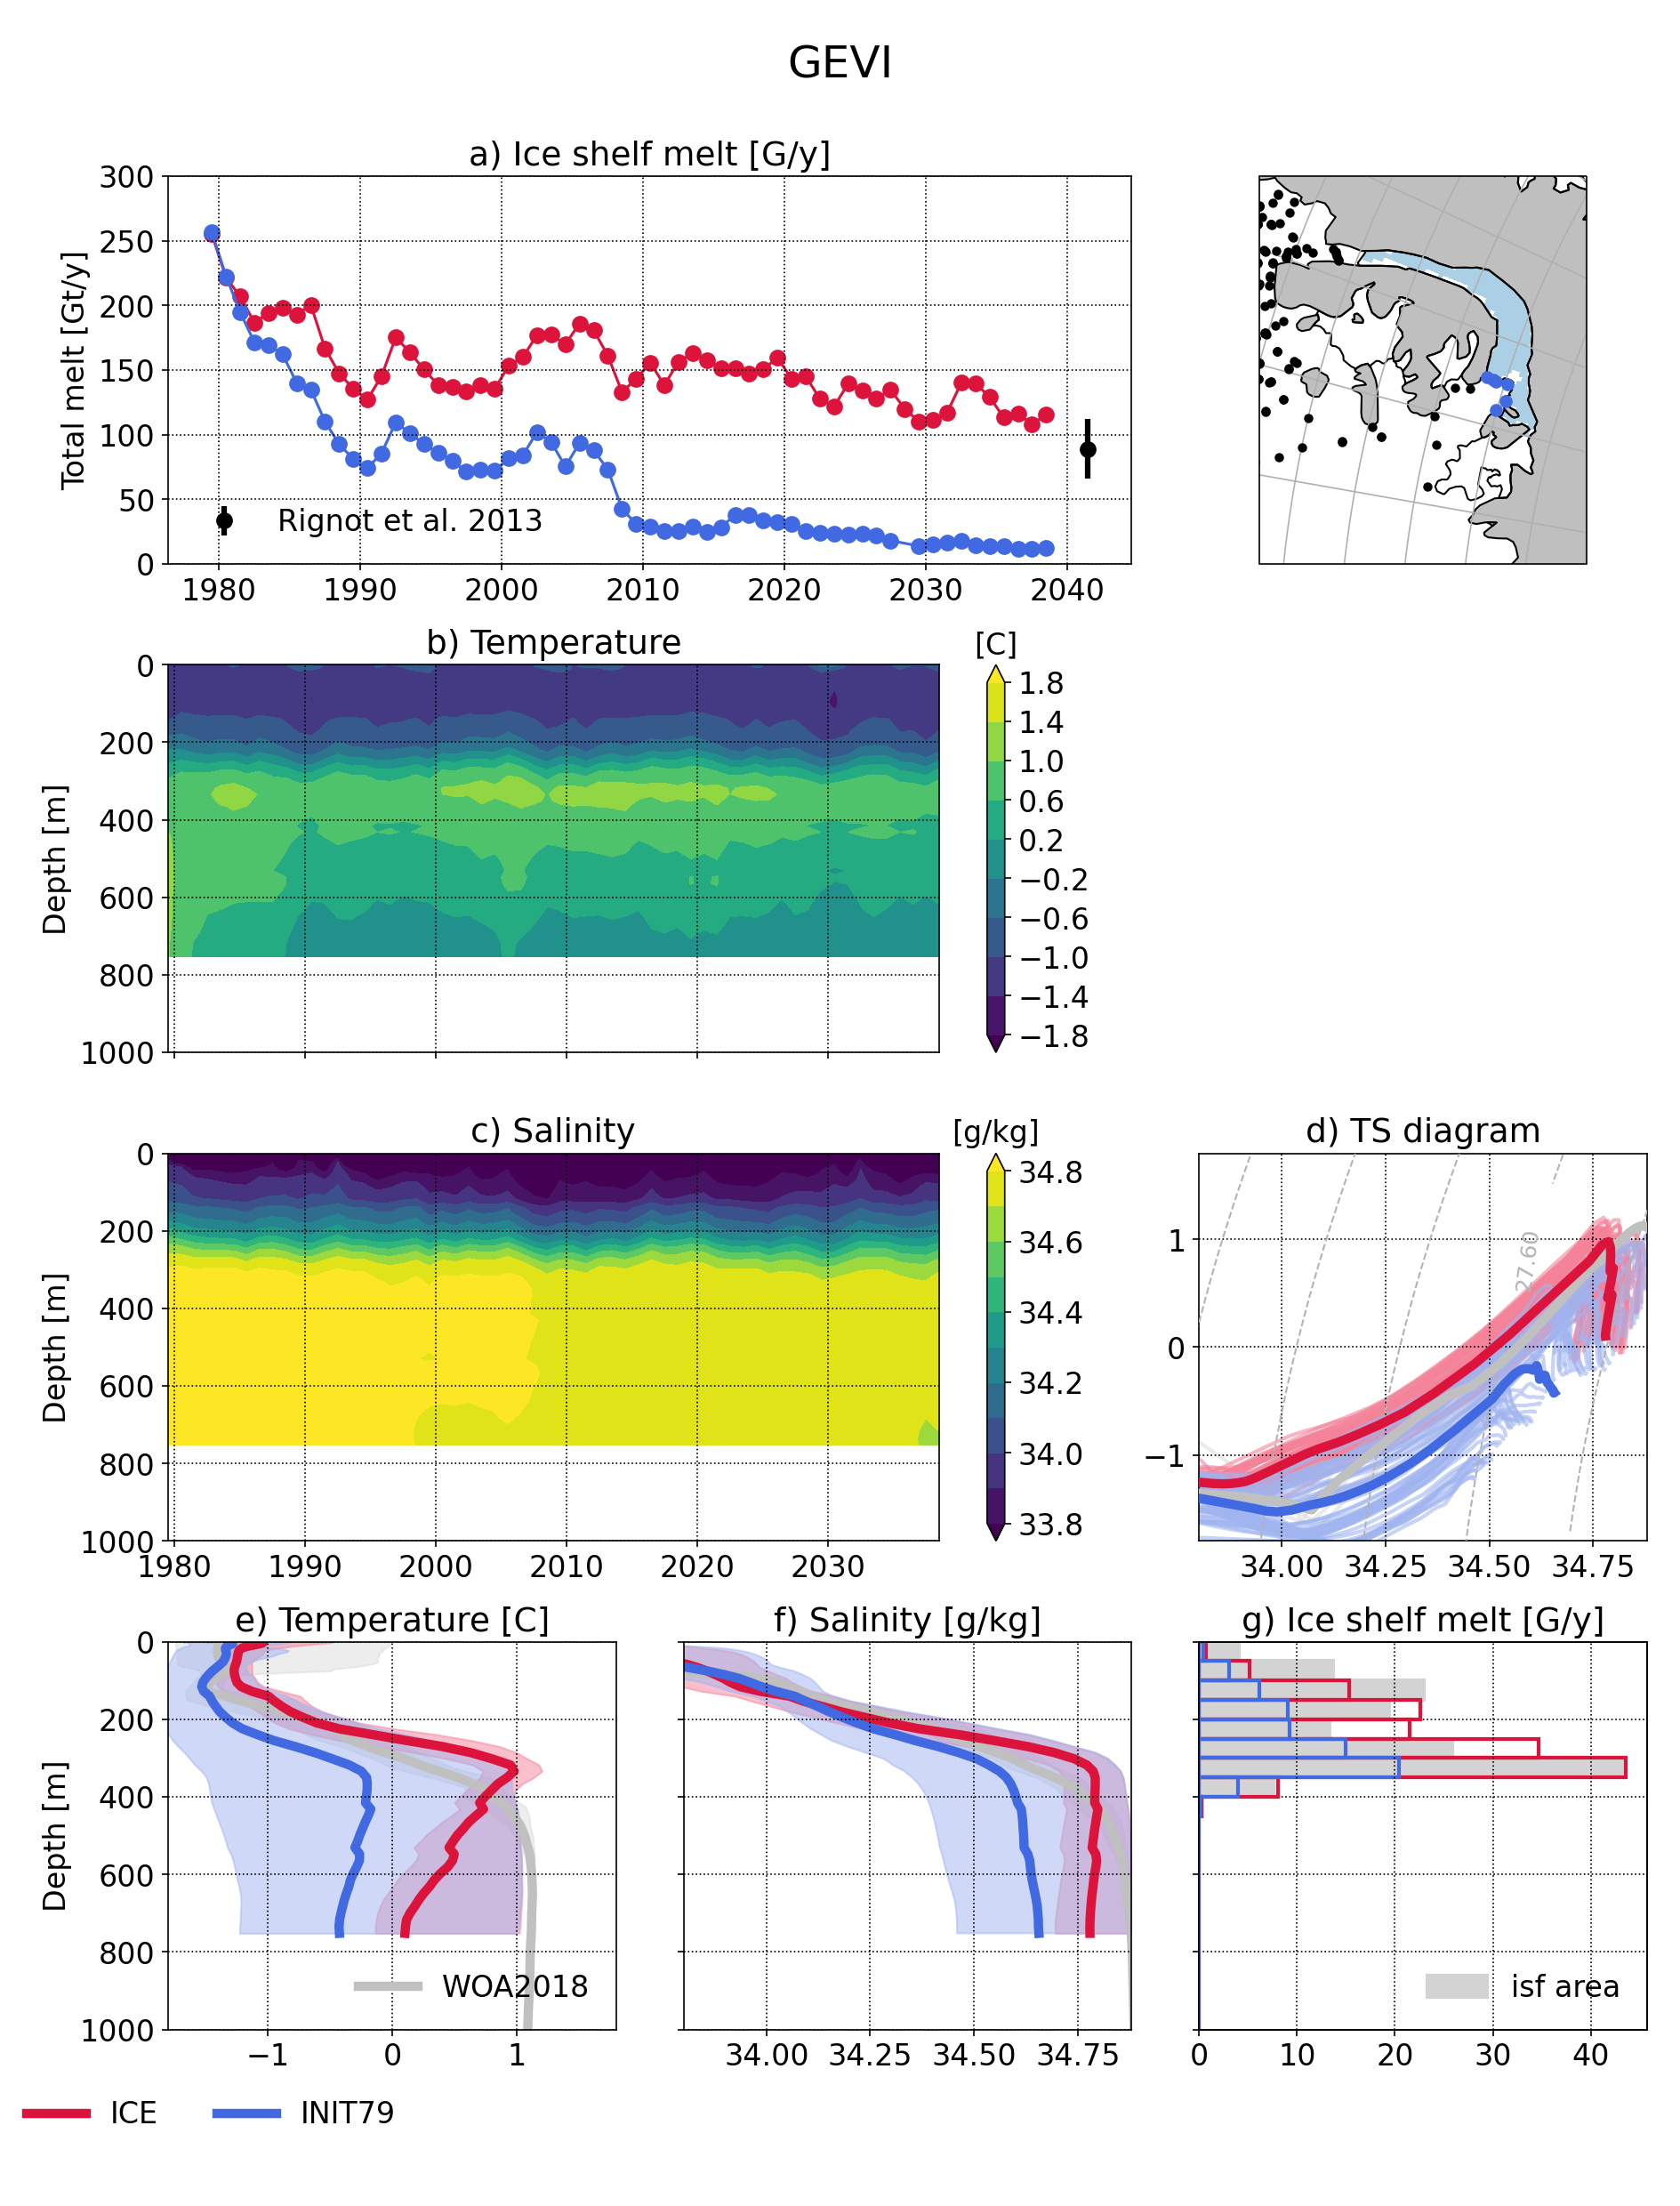
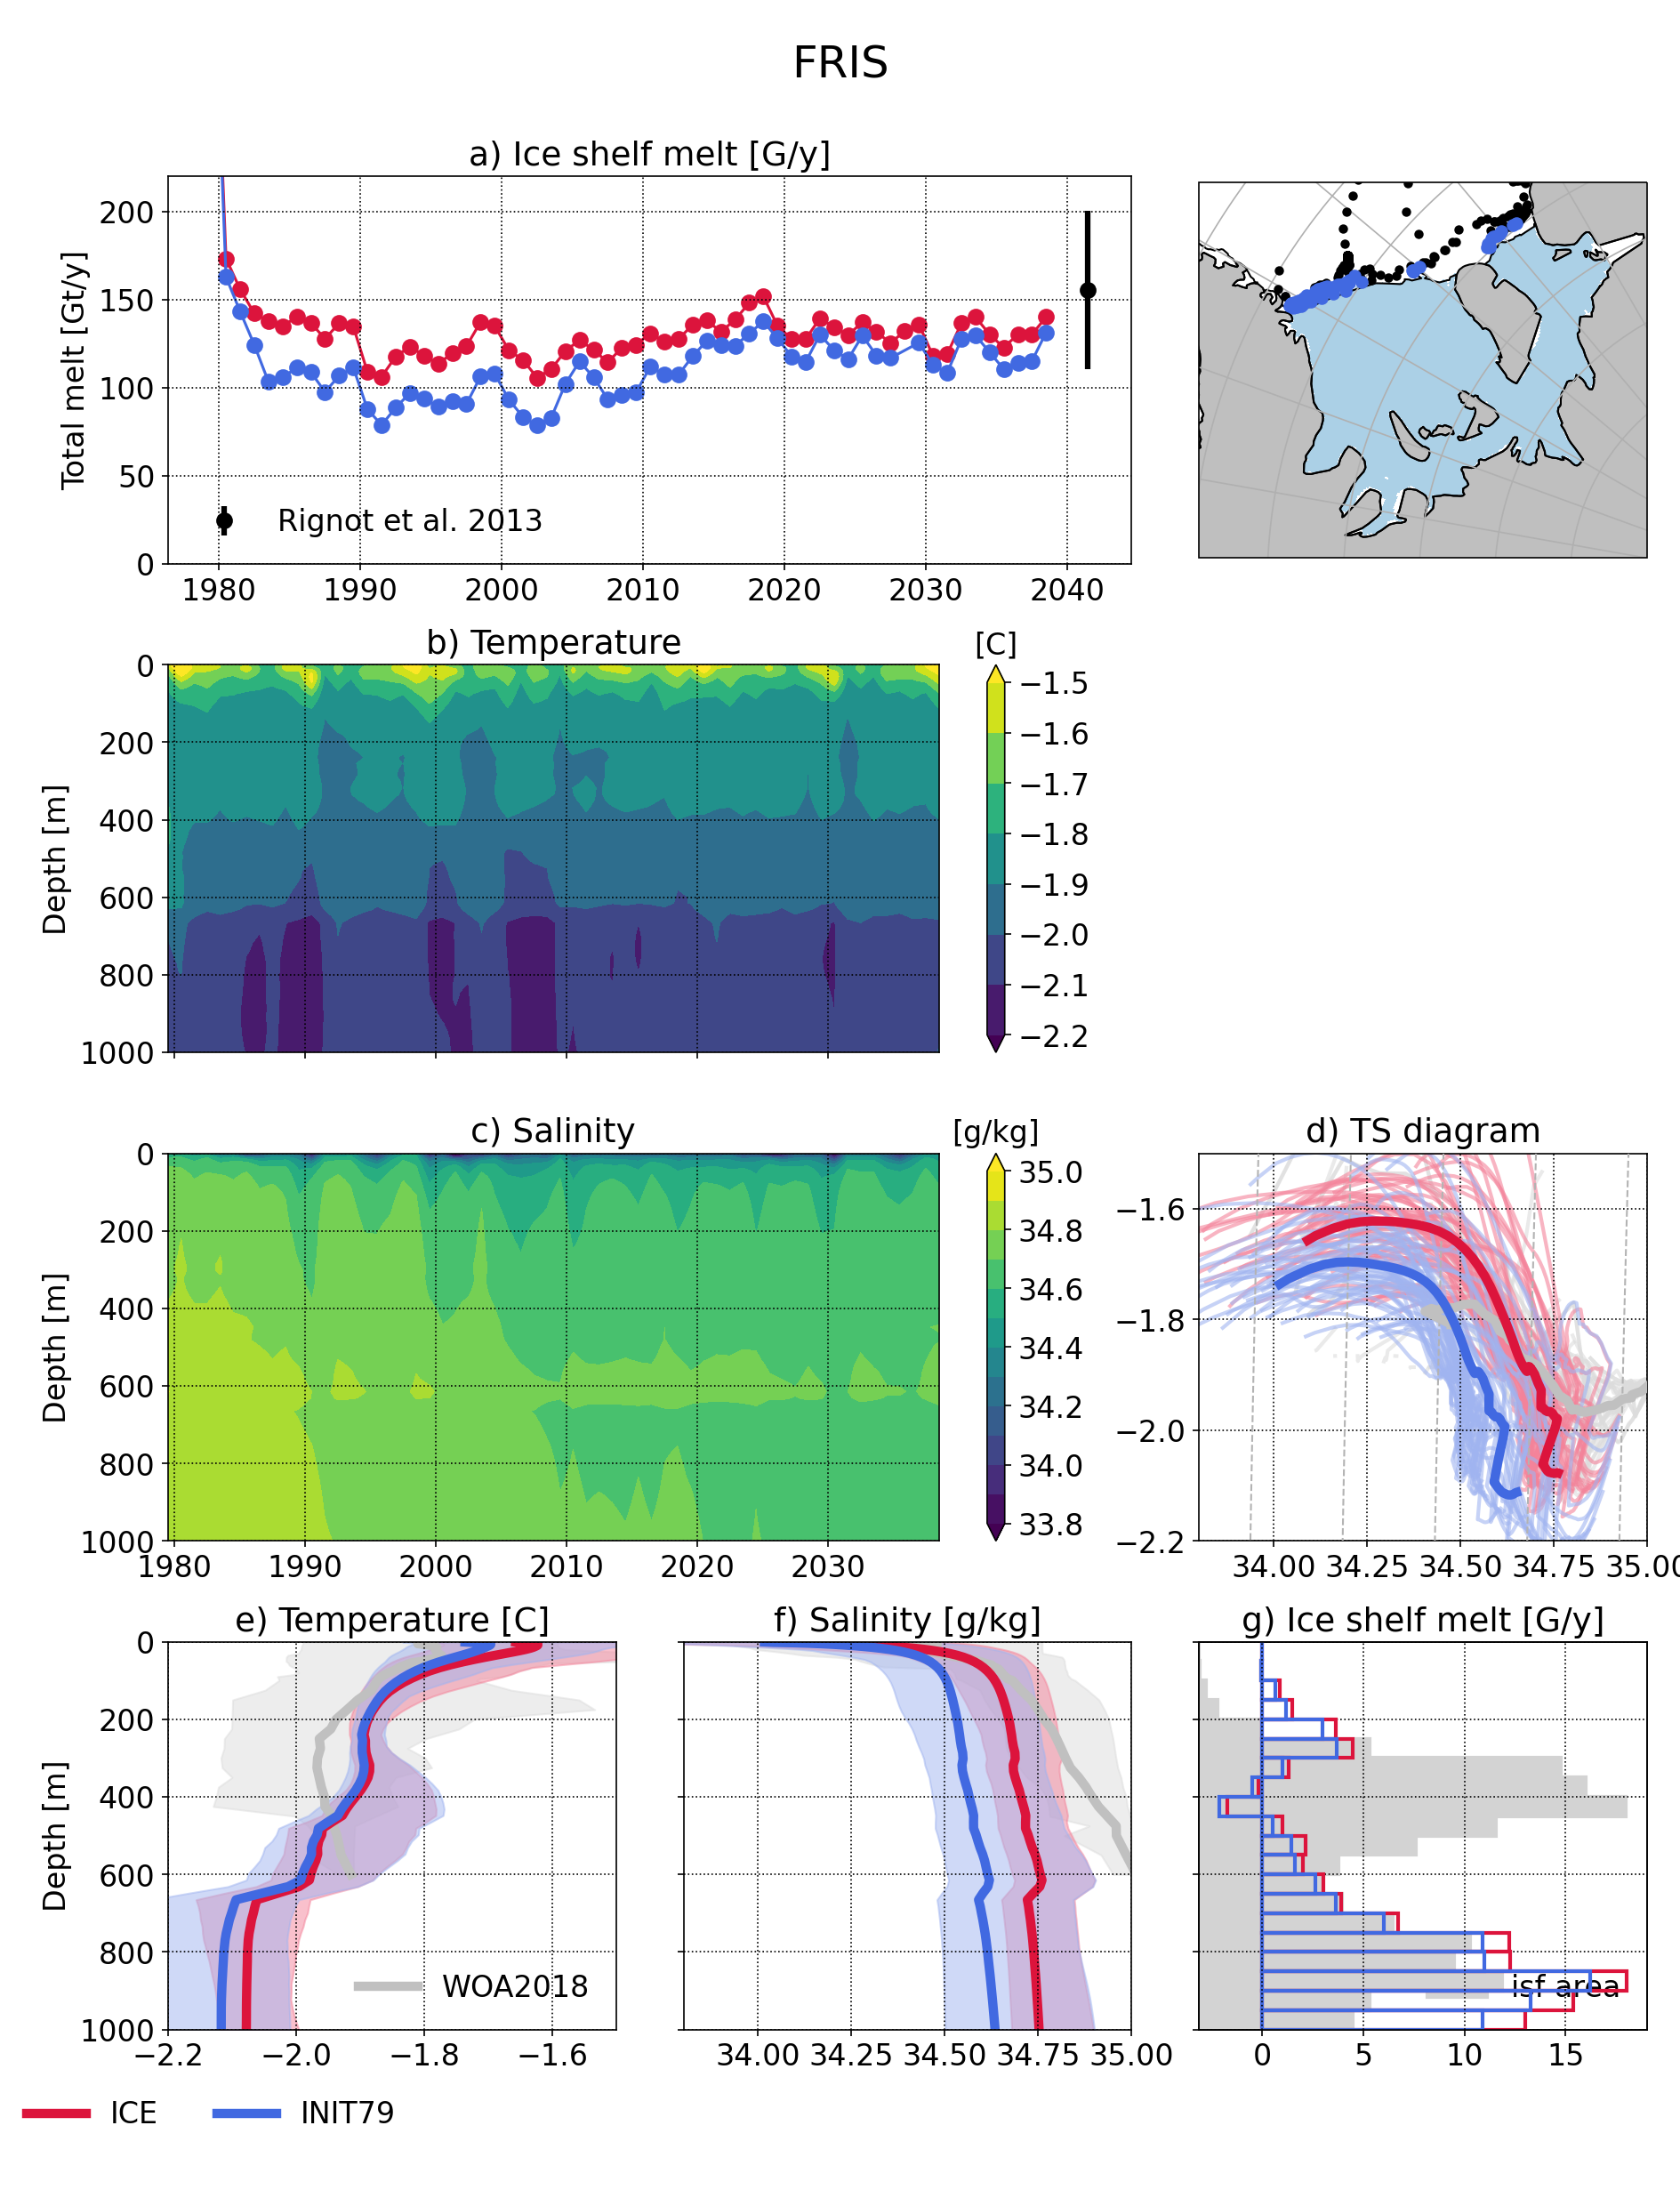
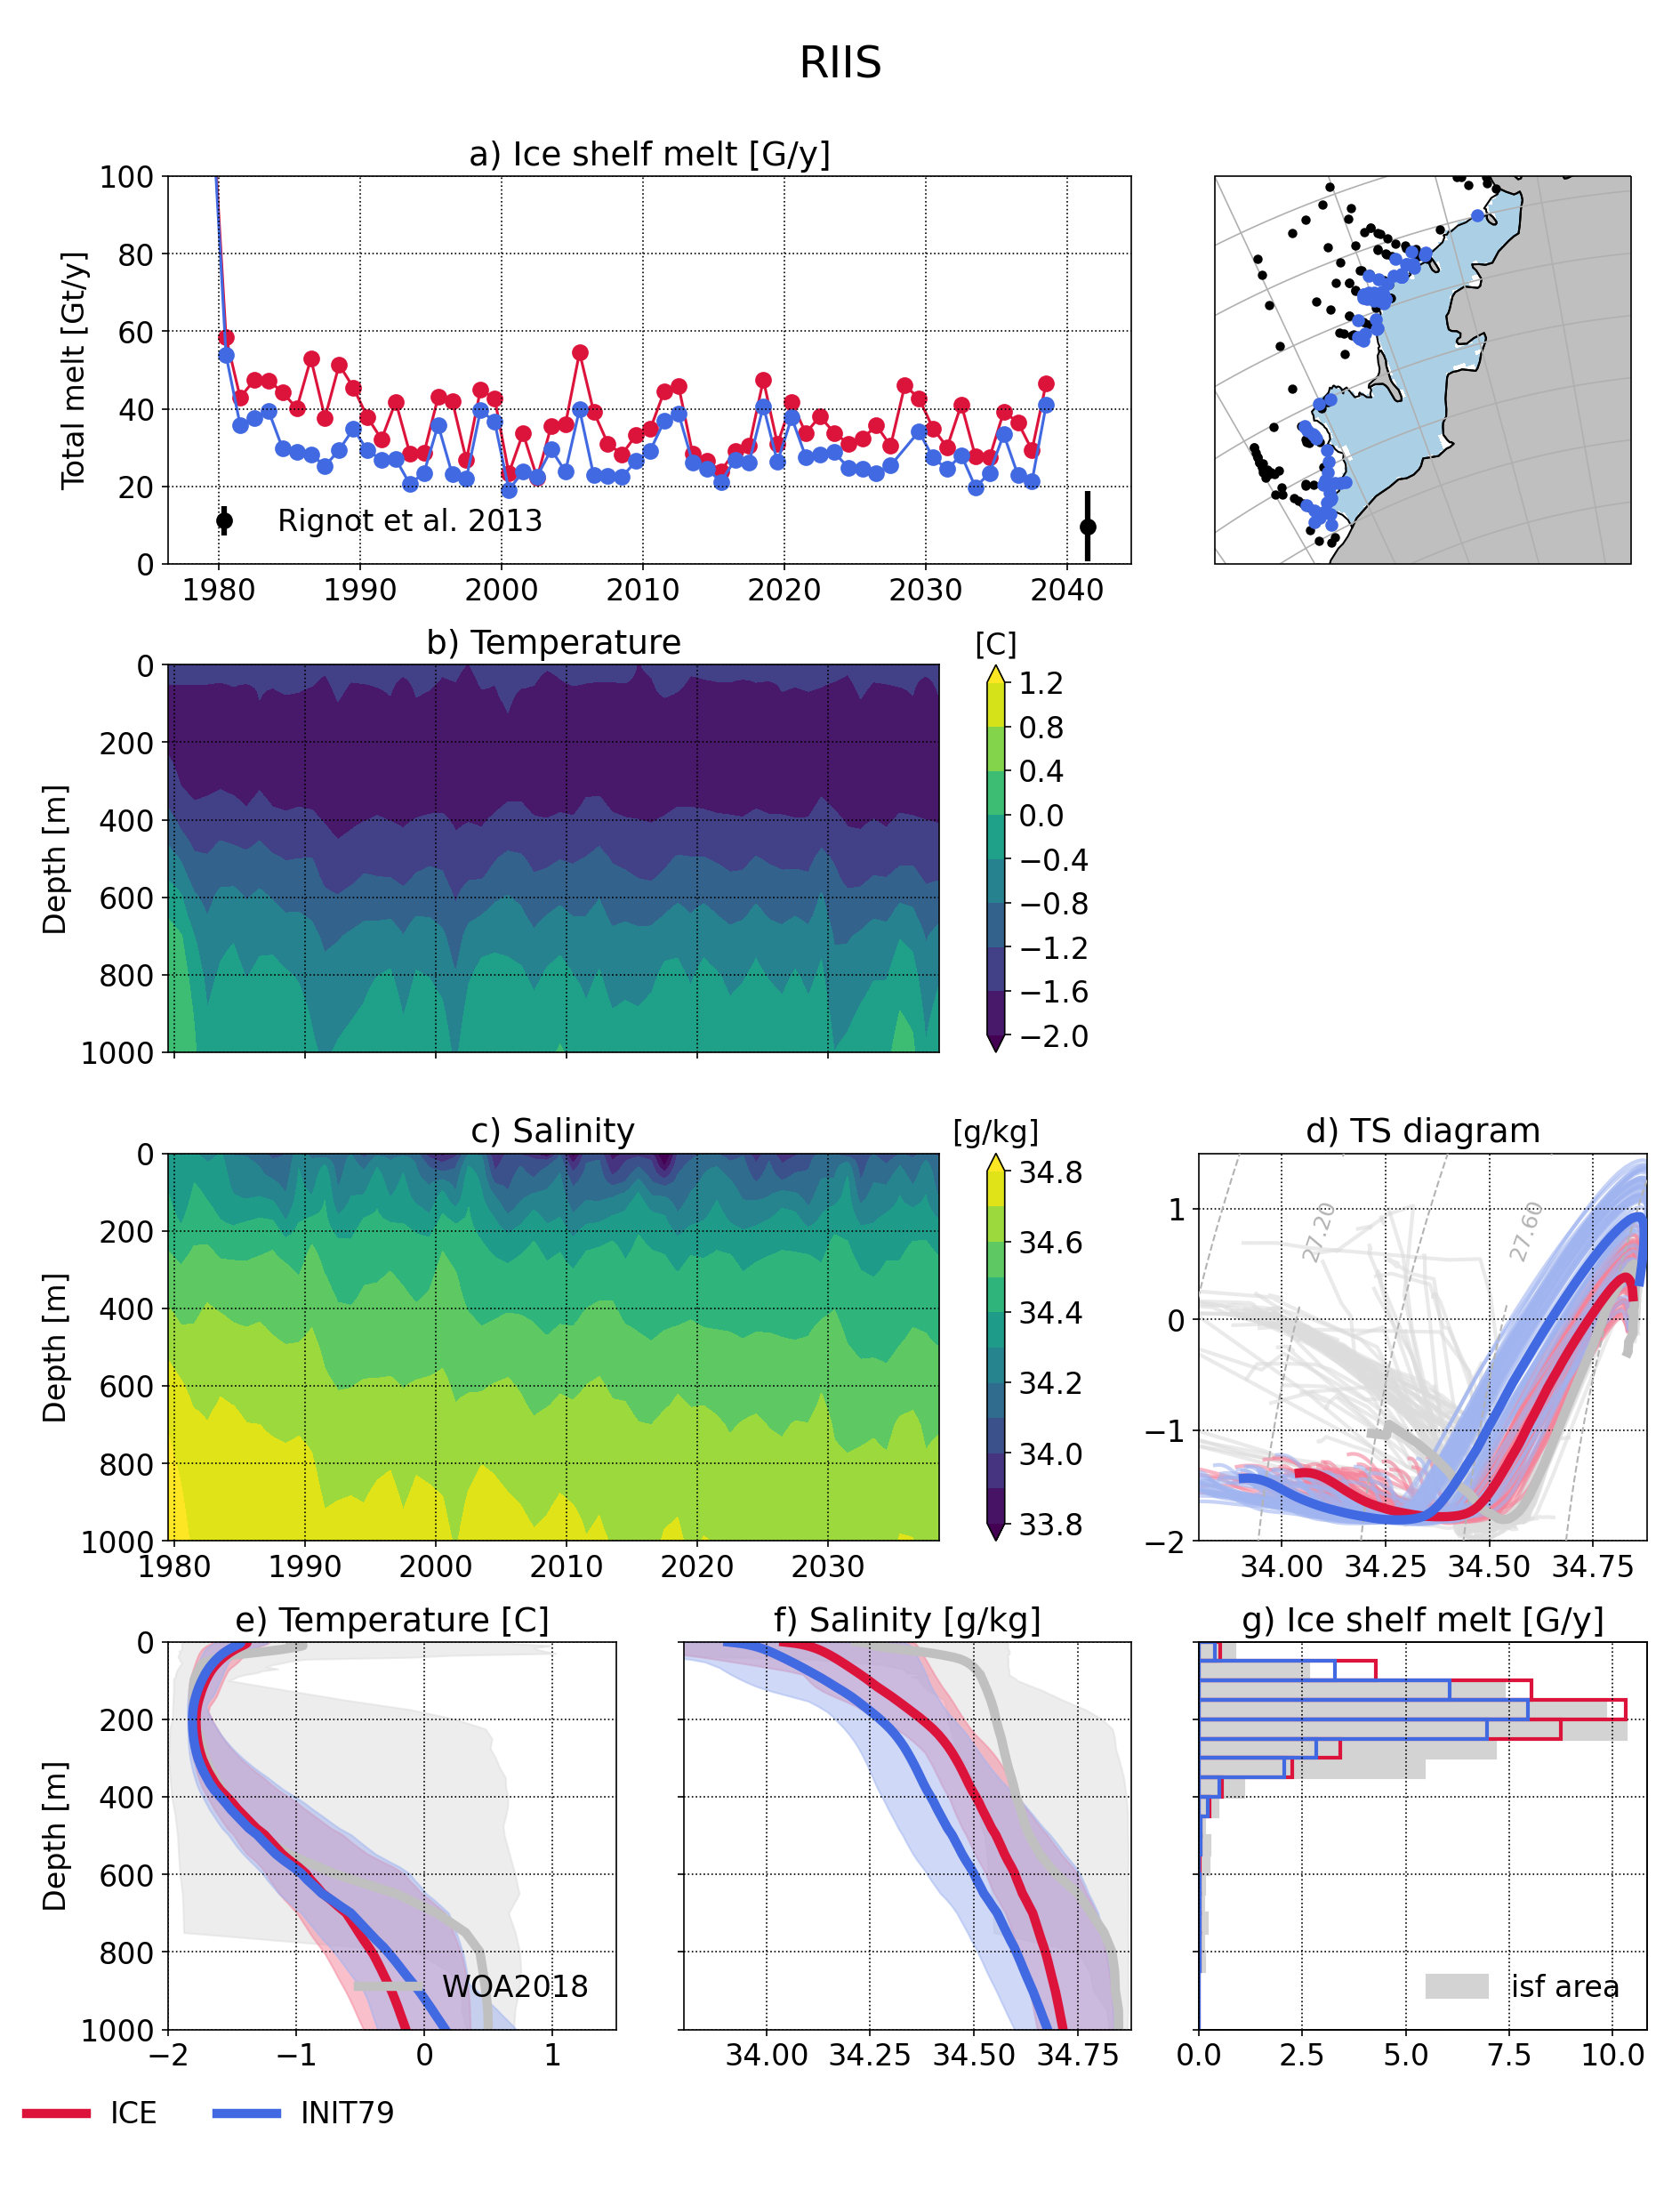
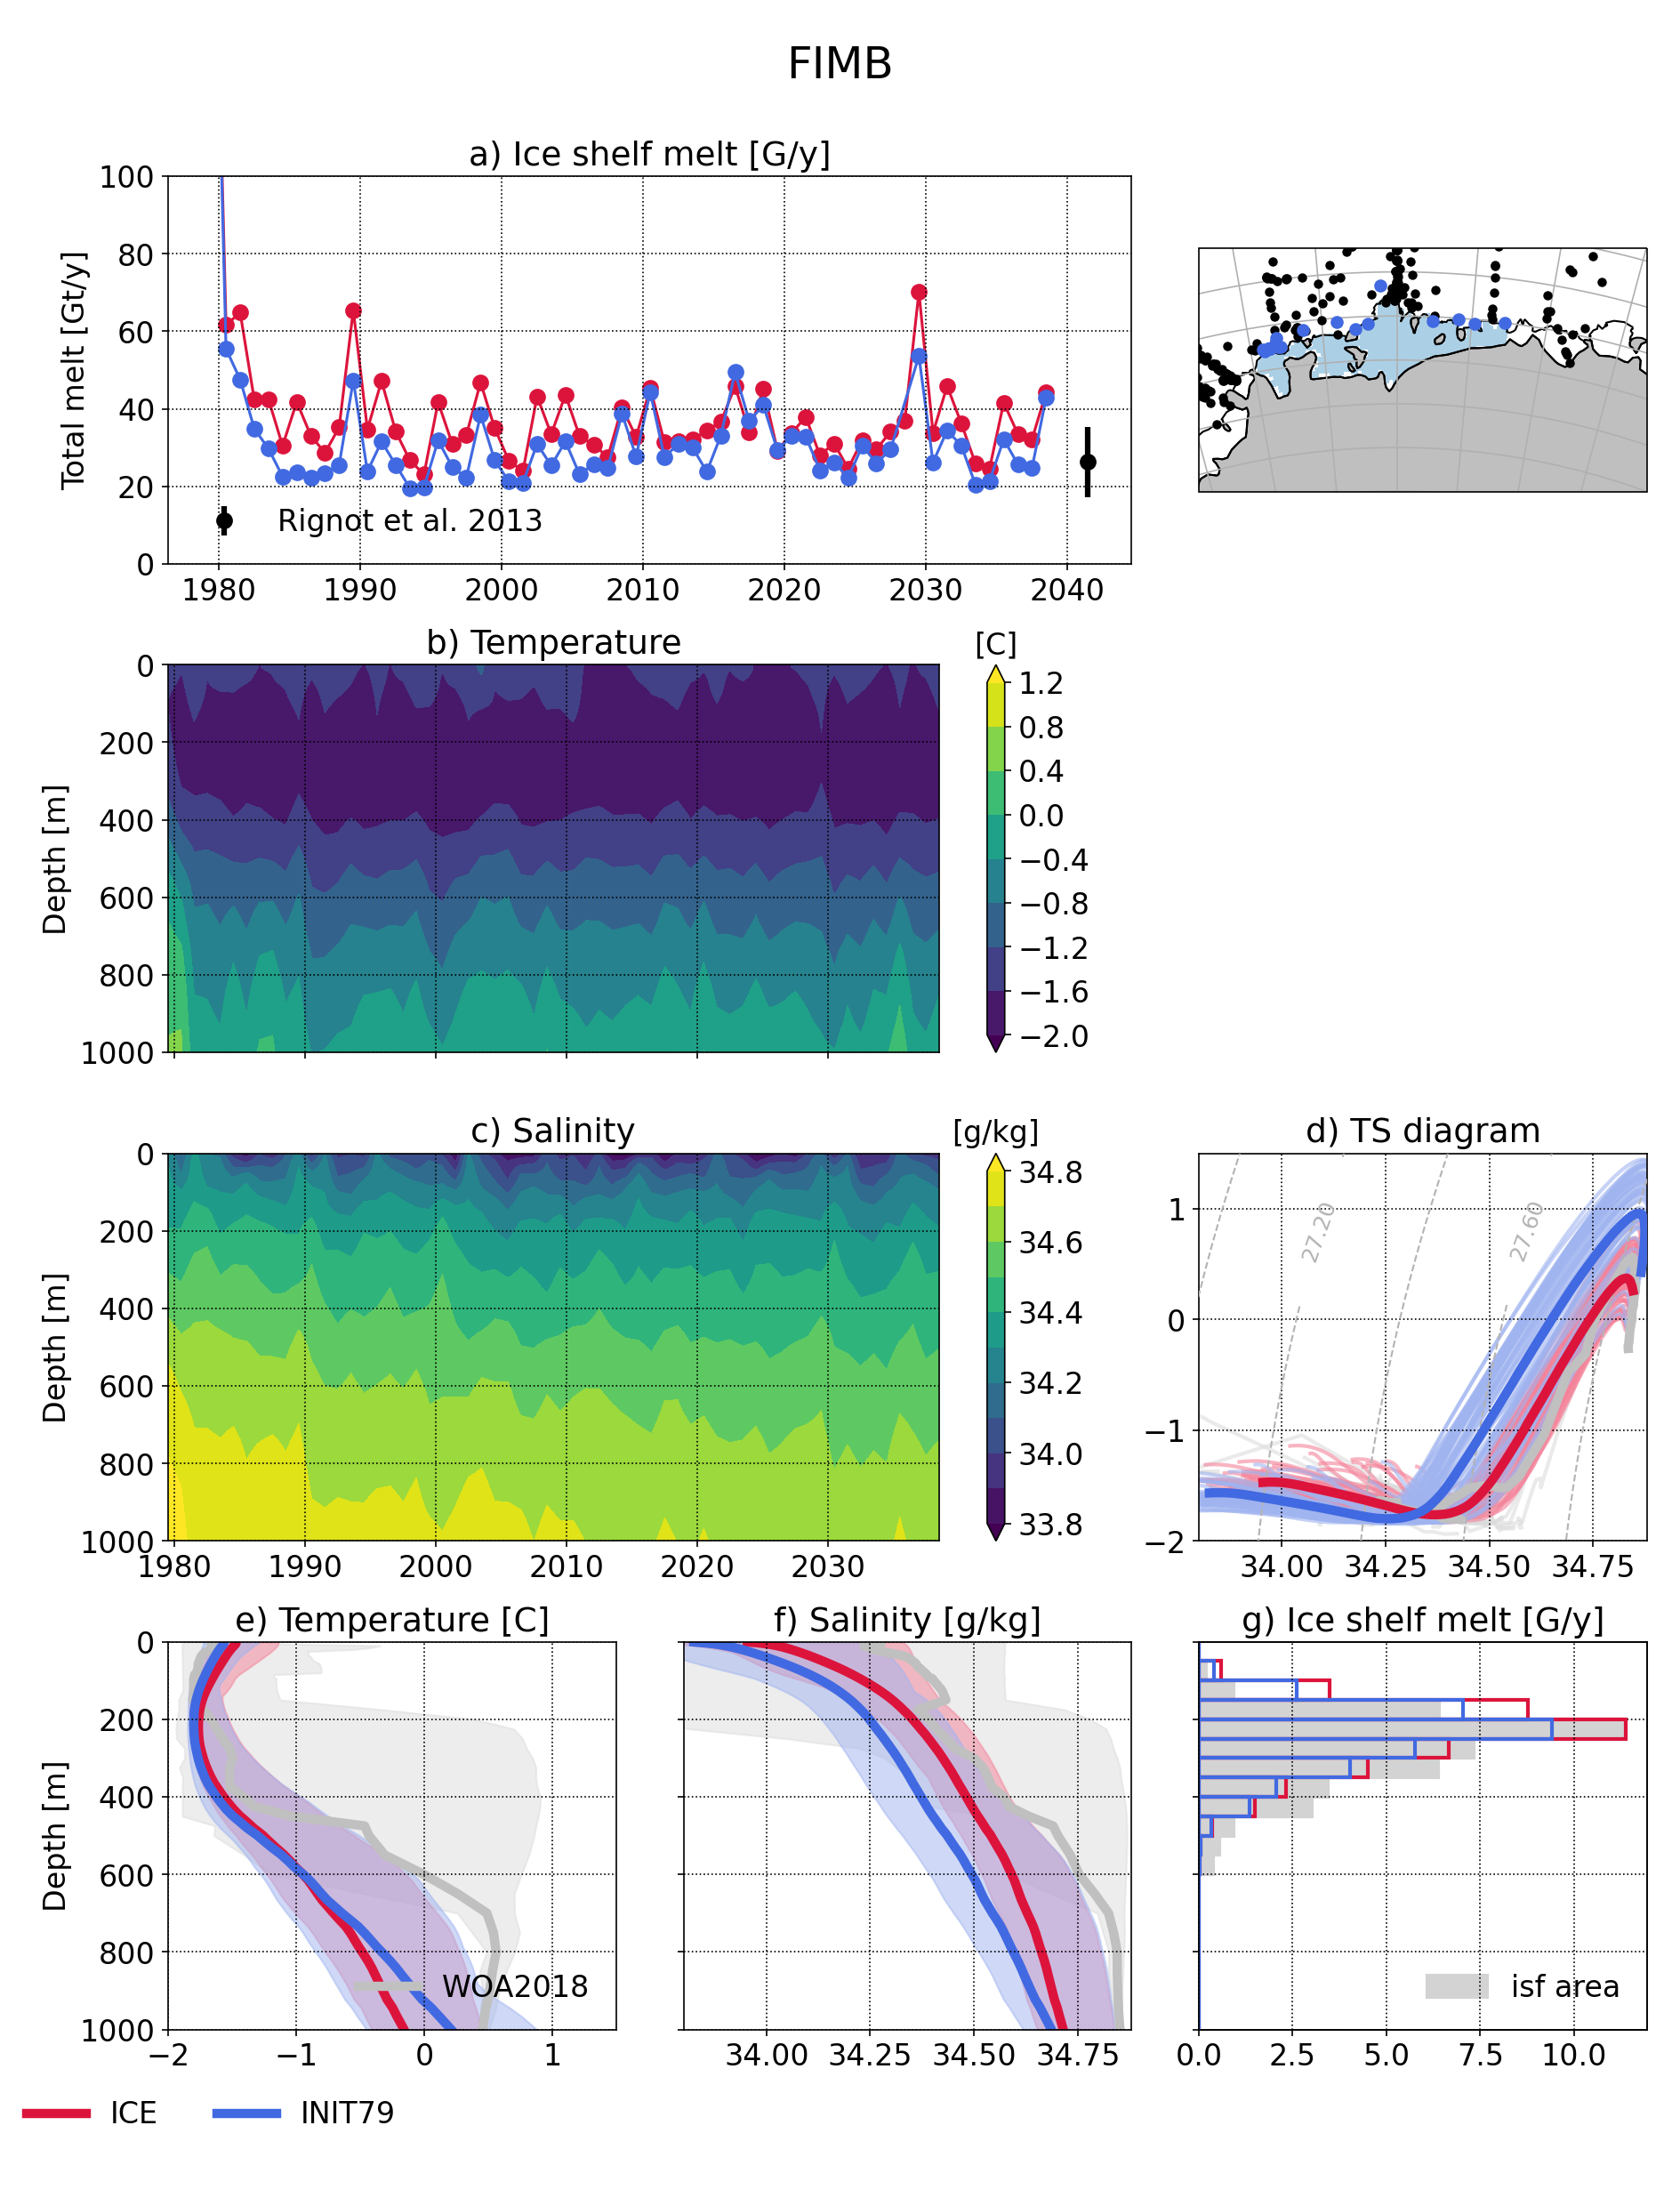
Local indicators
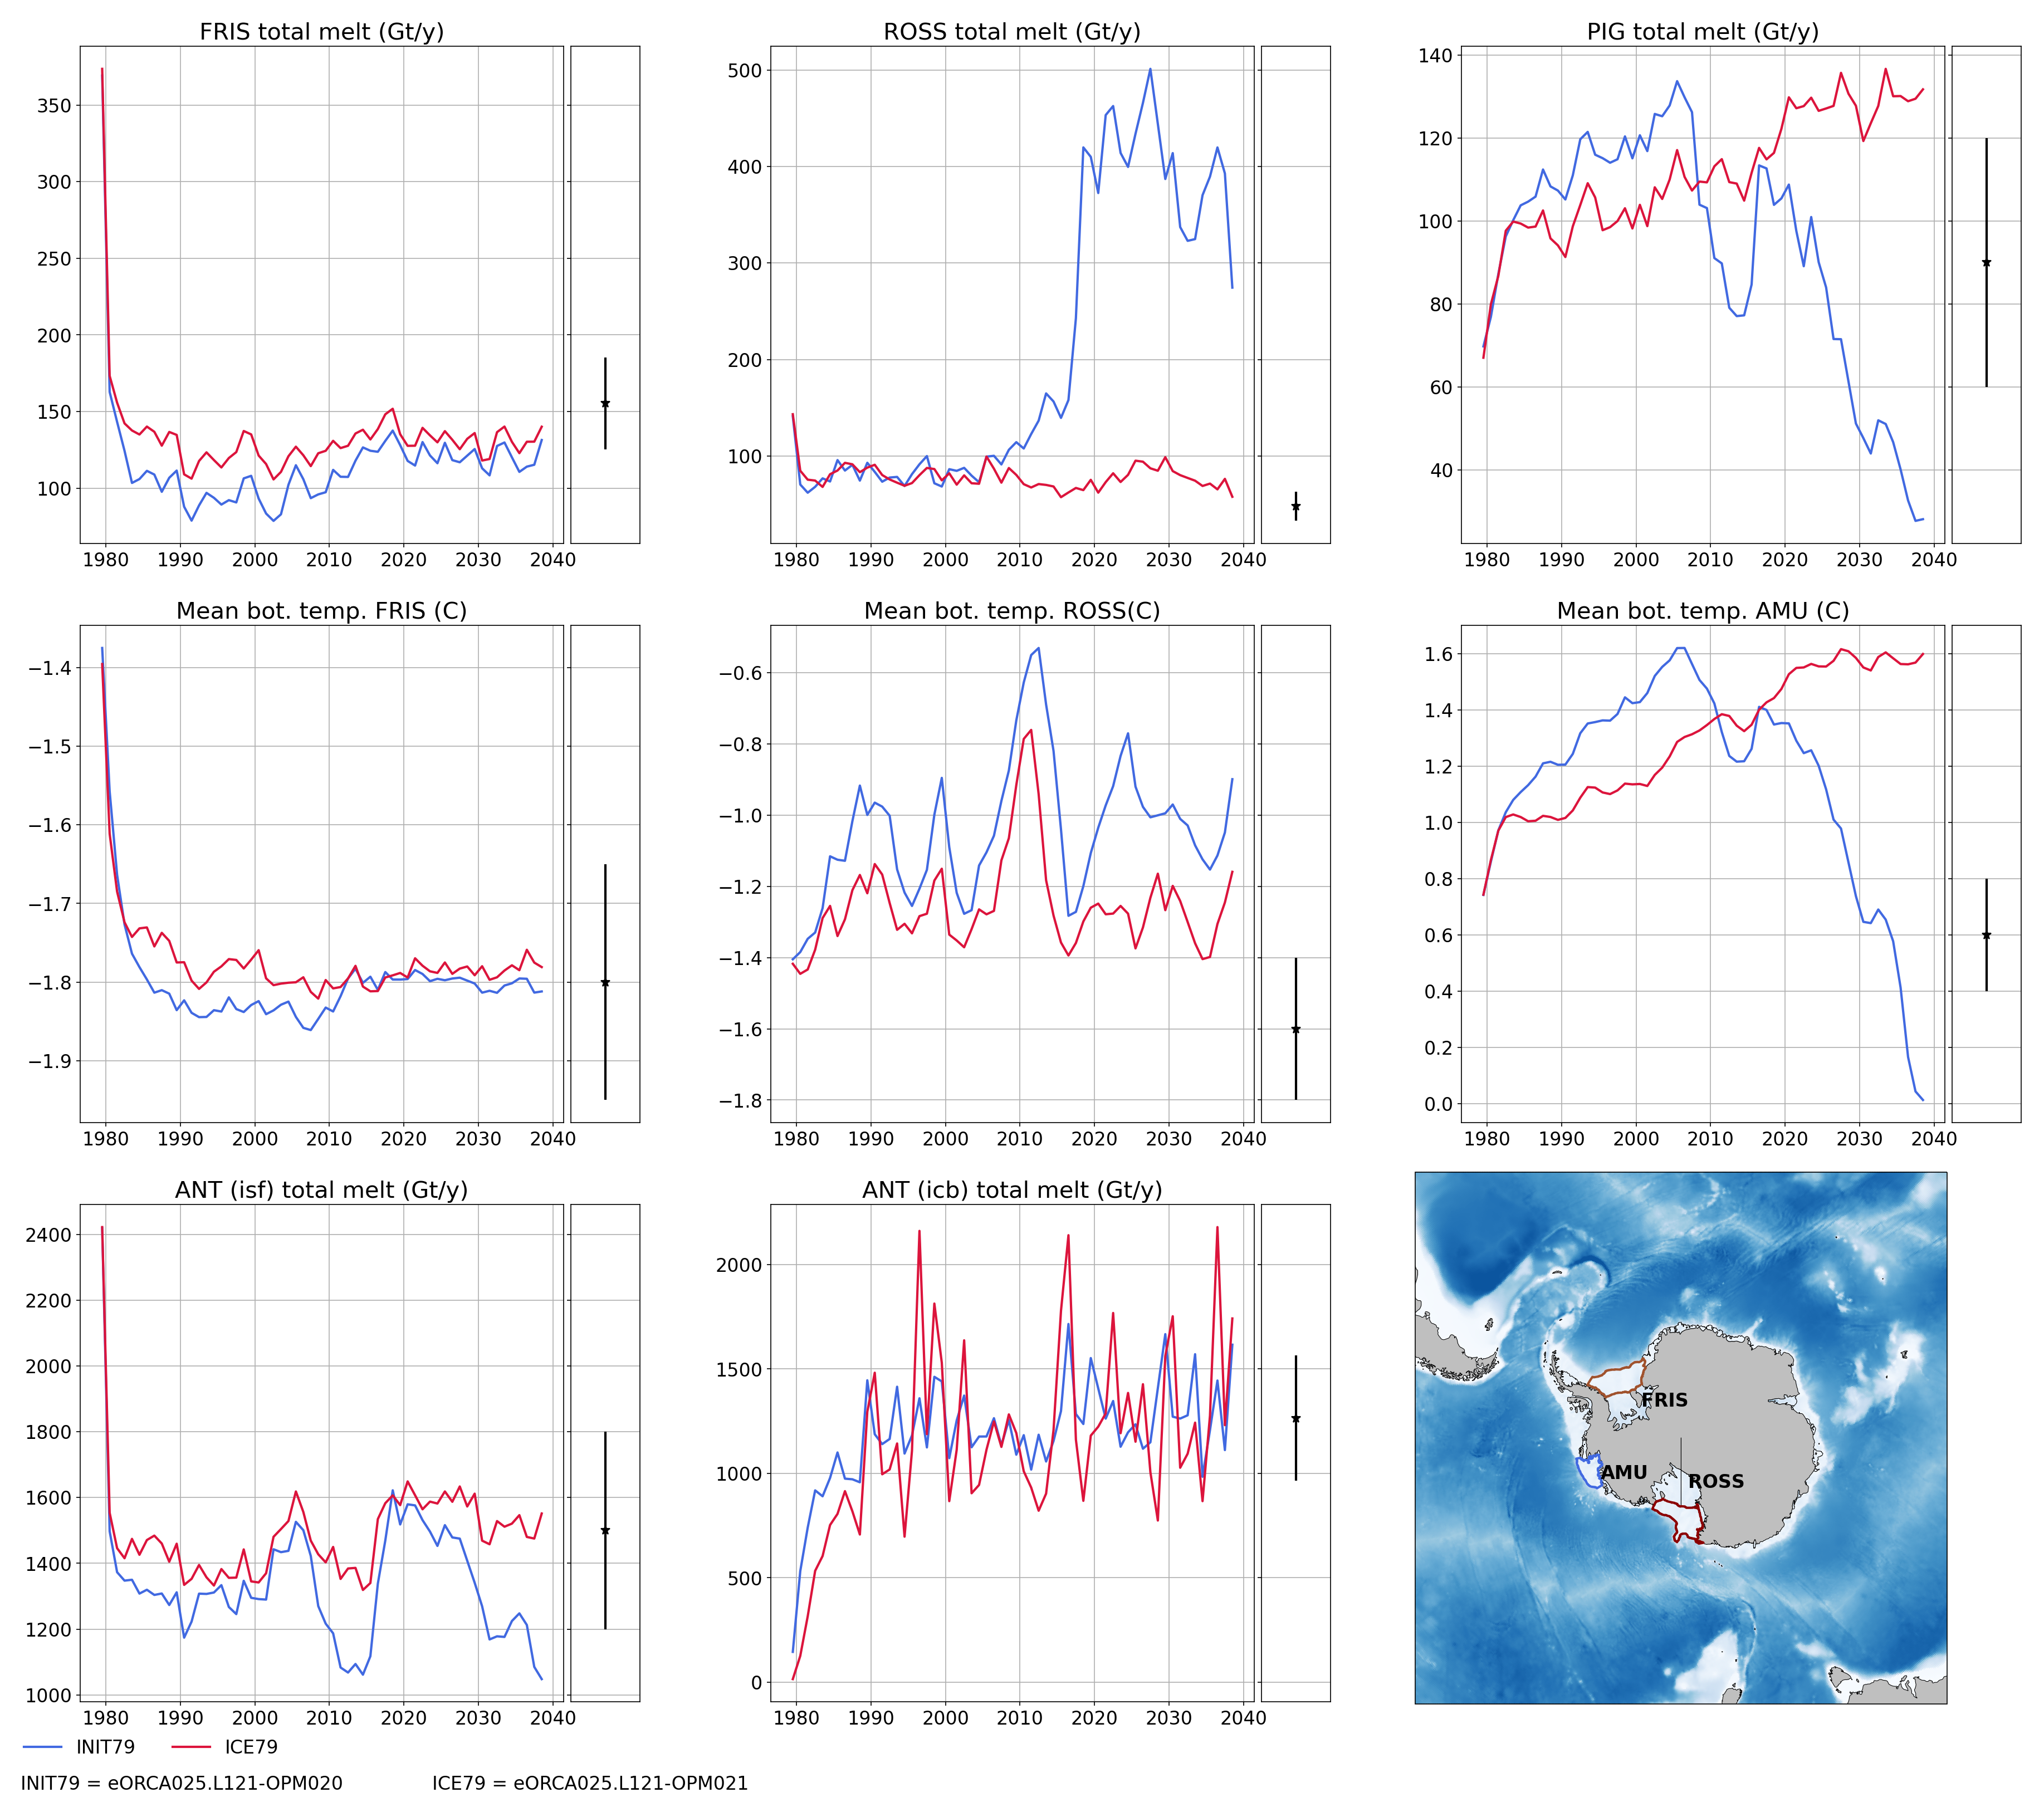
These plots monitor the evolution of ice shelf melting and the corresponding shelf properties (ROSS, FRIS, PINE, GETZ)
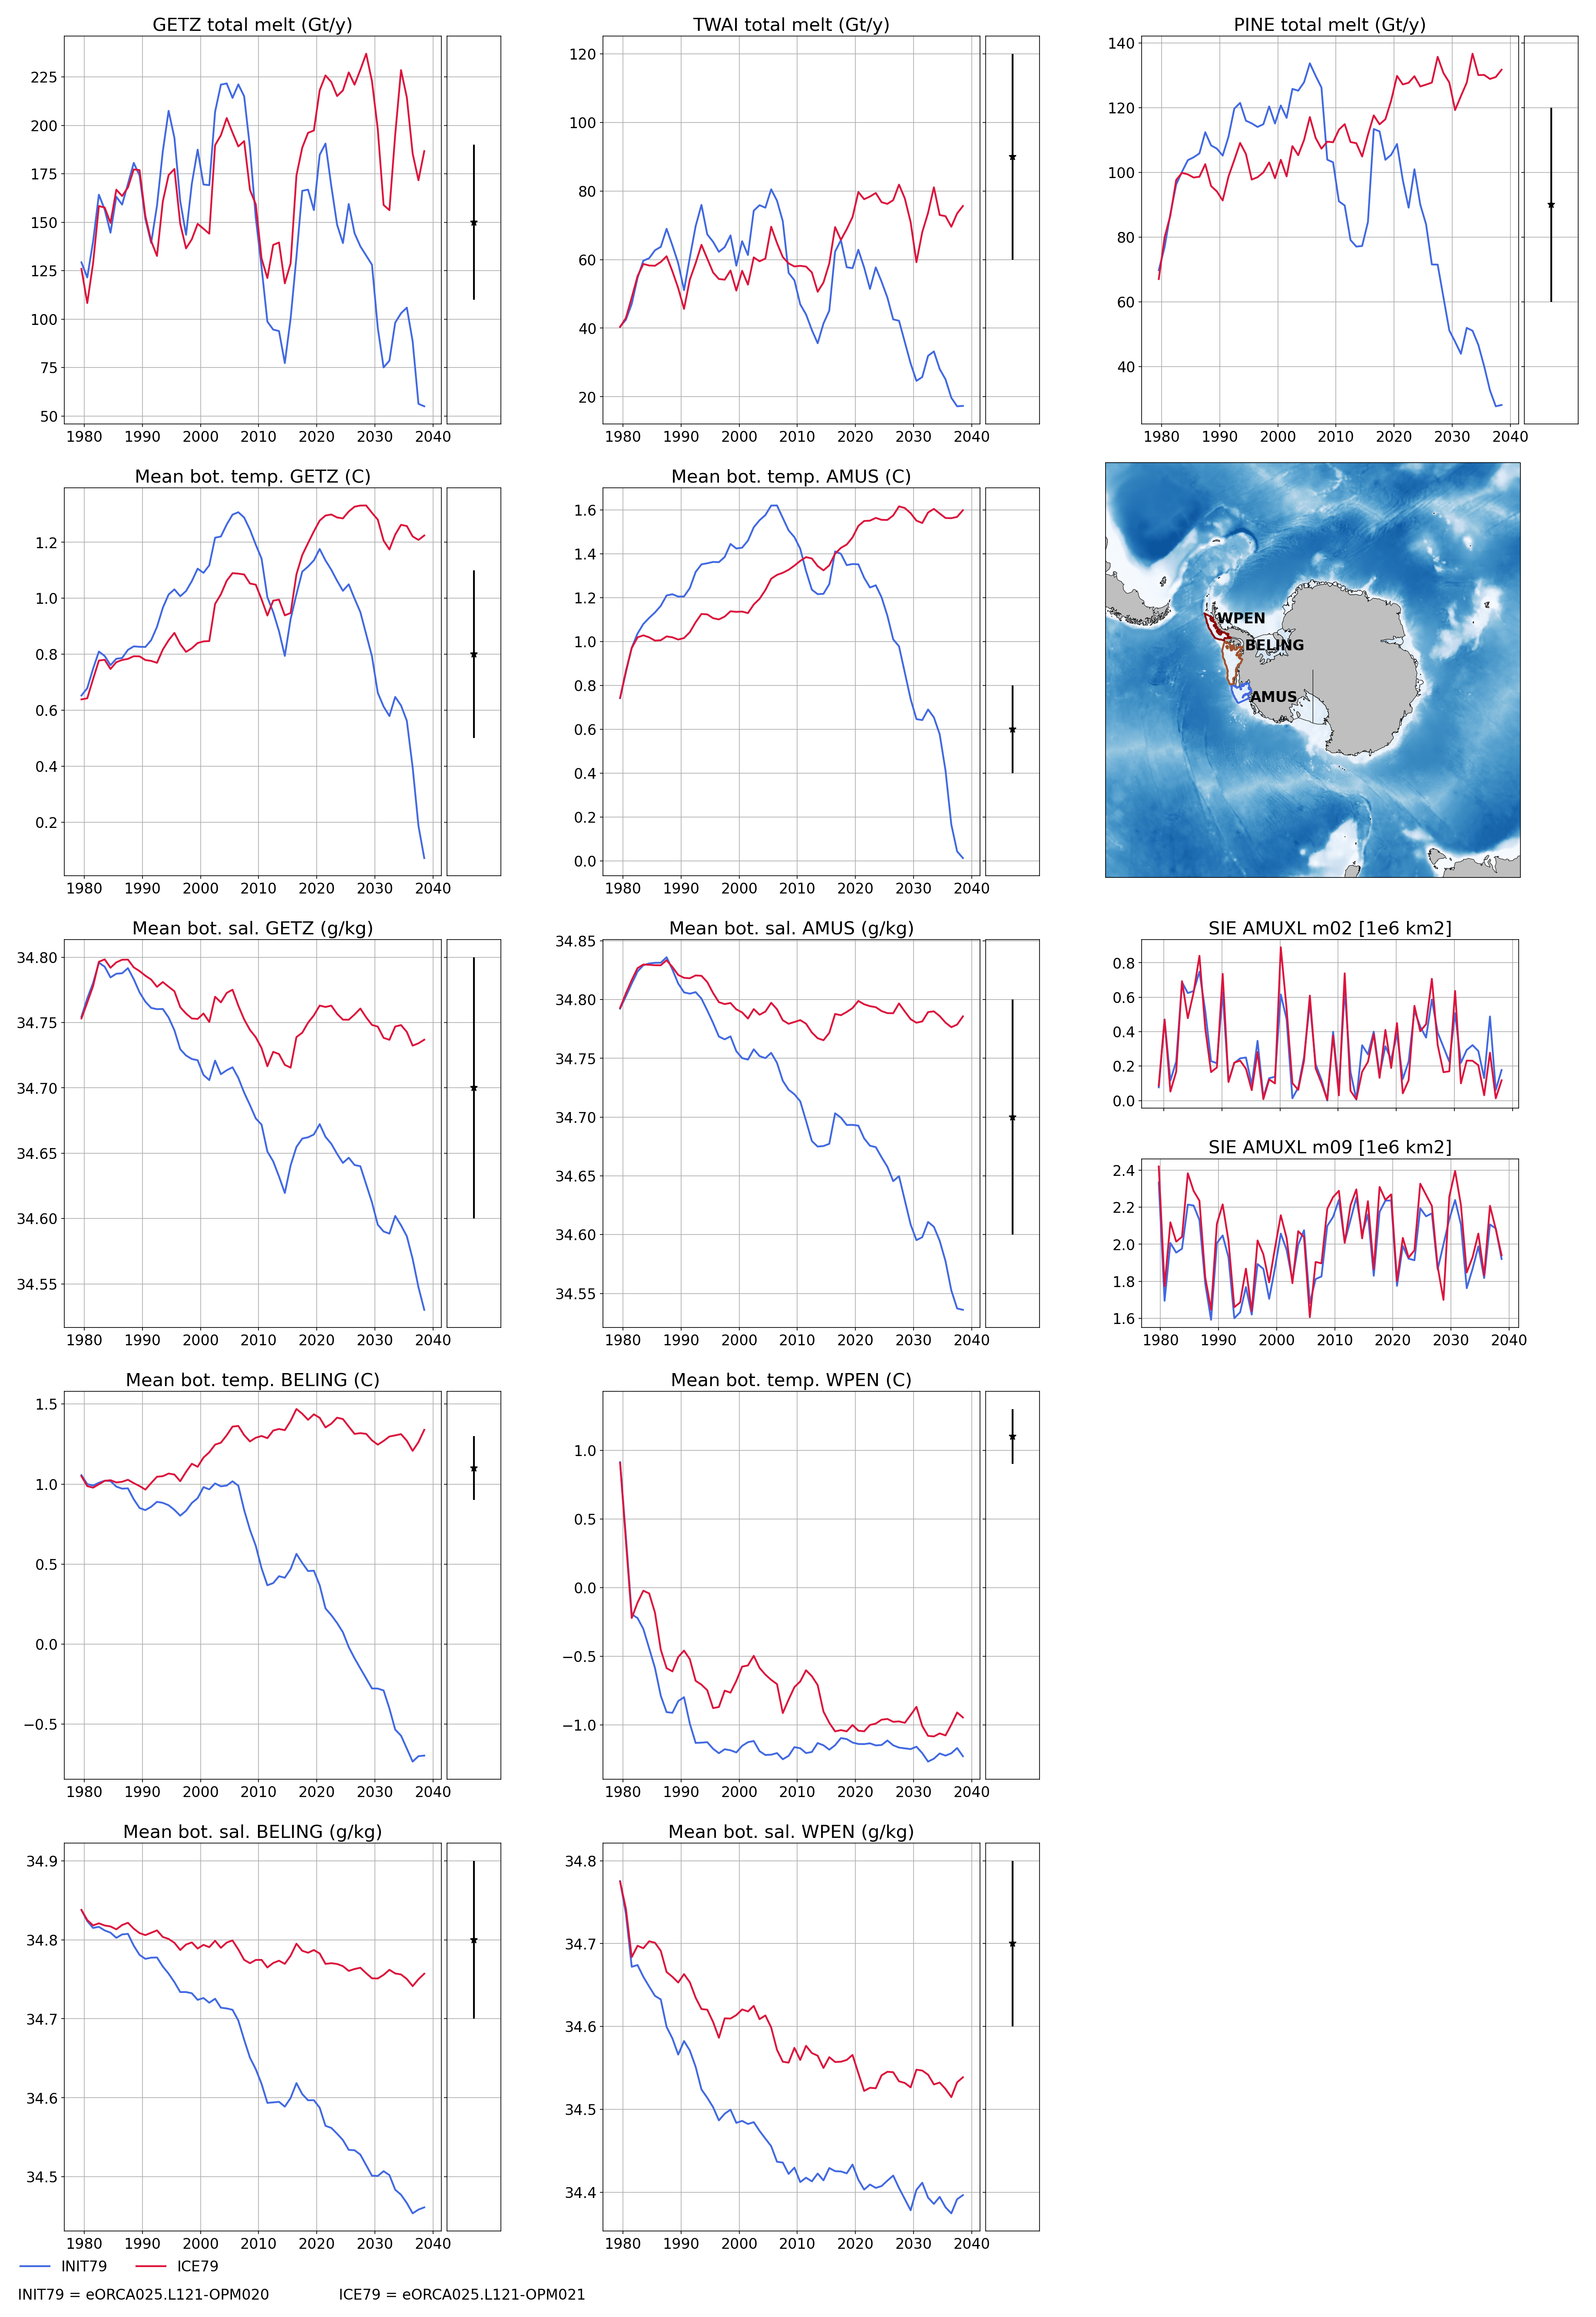
Amundsen/Belingshausen seas
These plot monitoring the evolution of temperature, salinity and ice shelf melt in Amundsen sea.
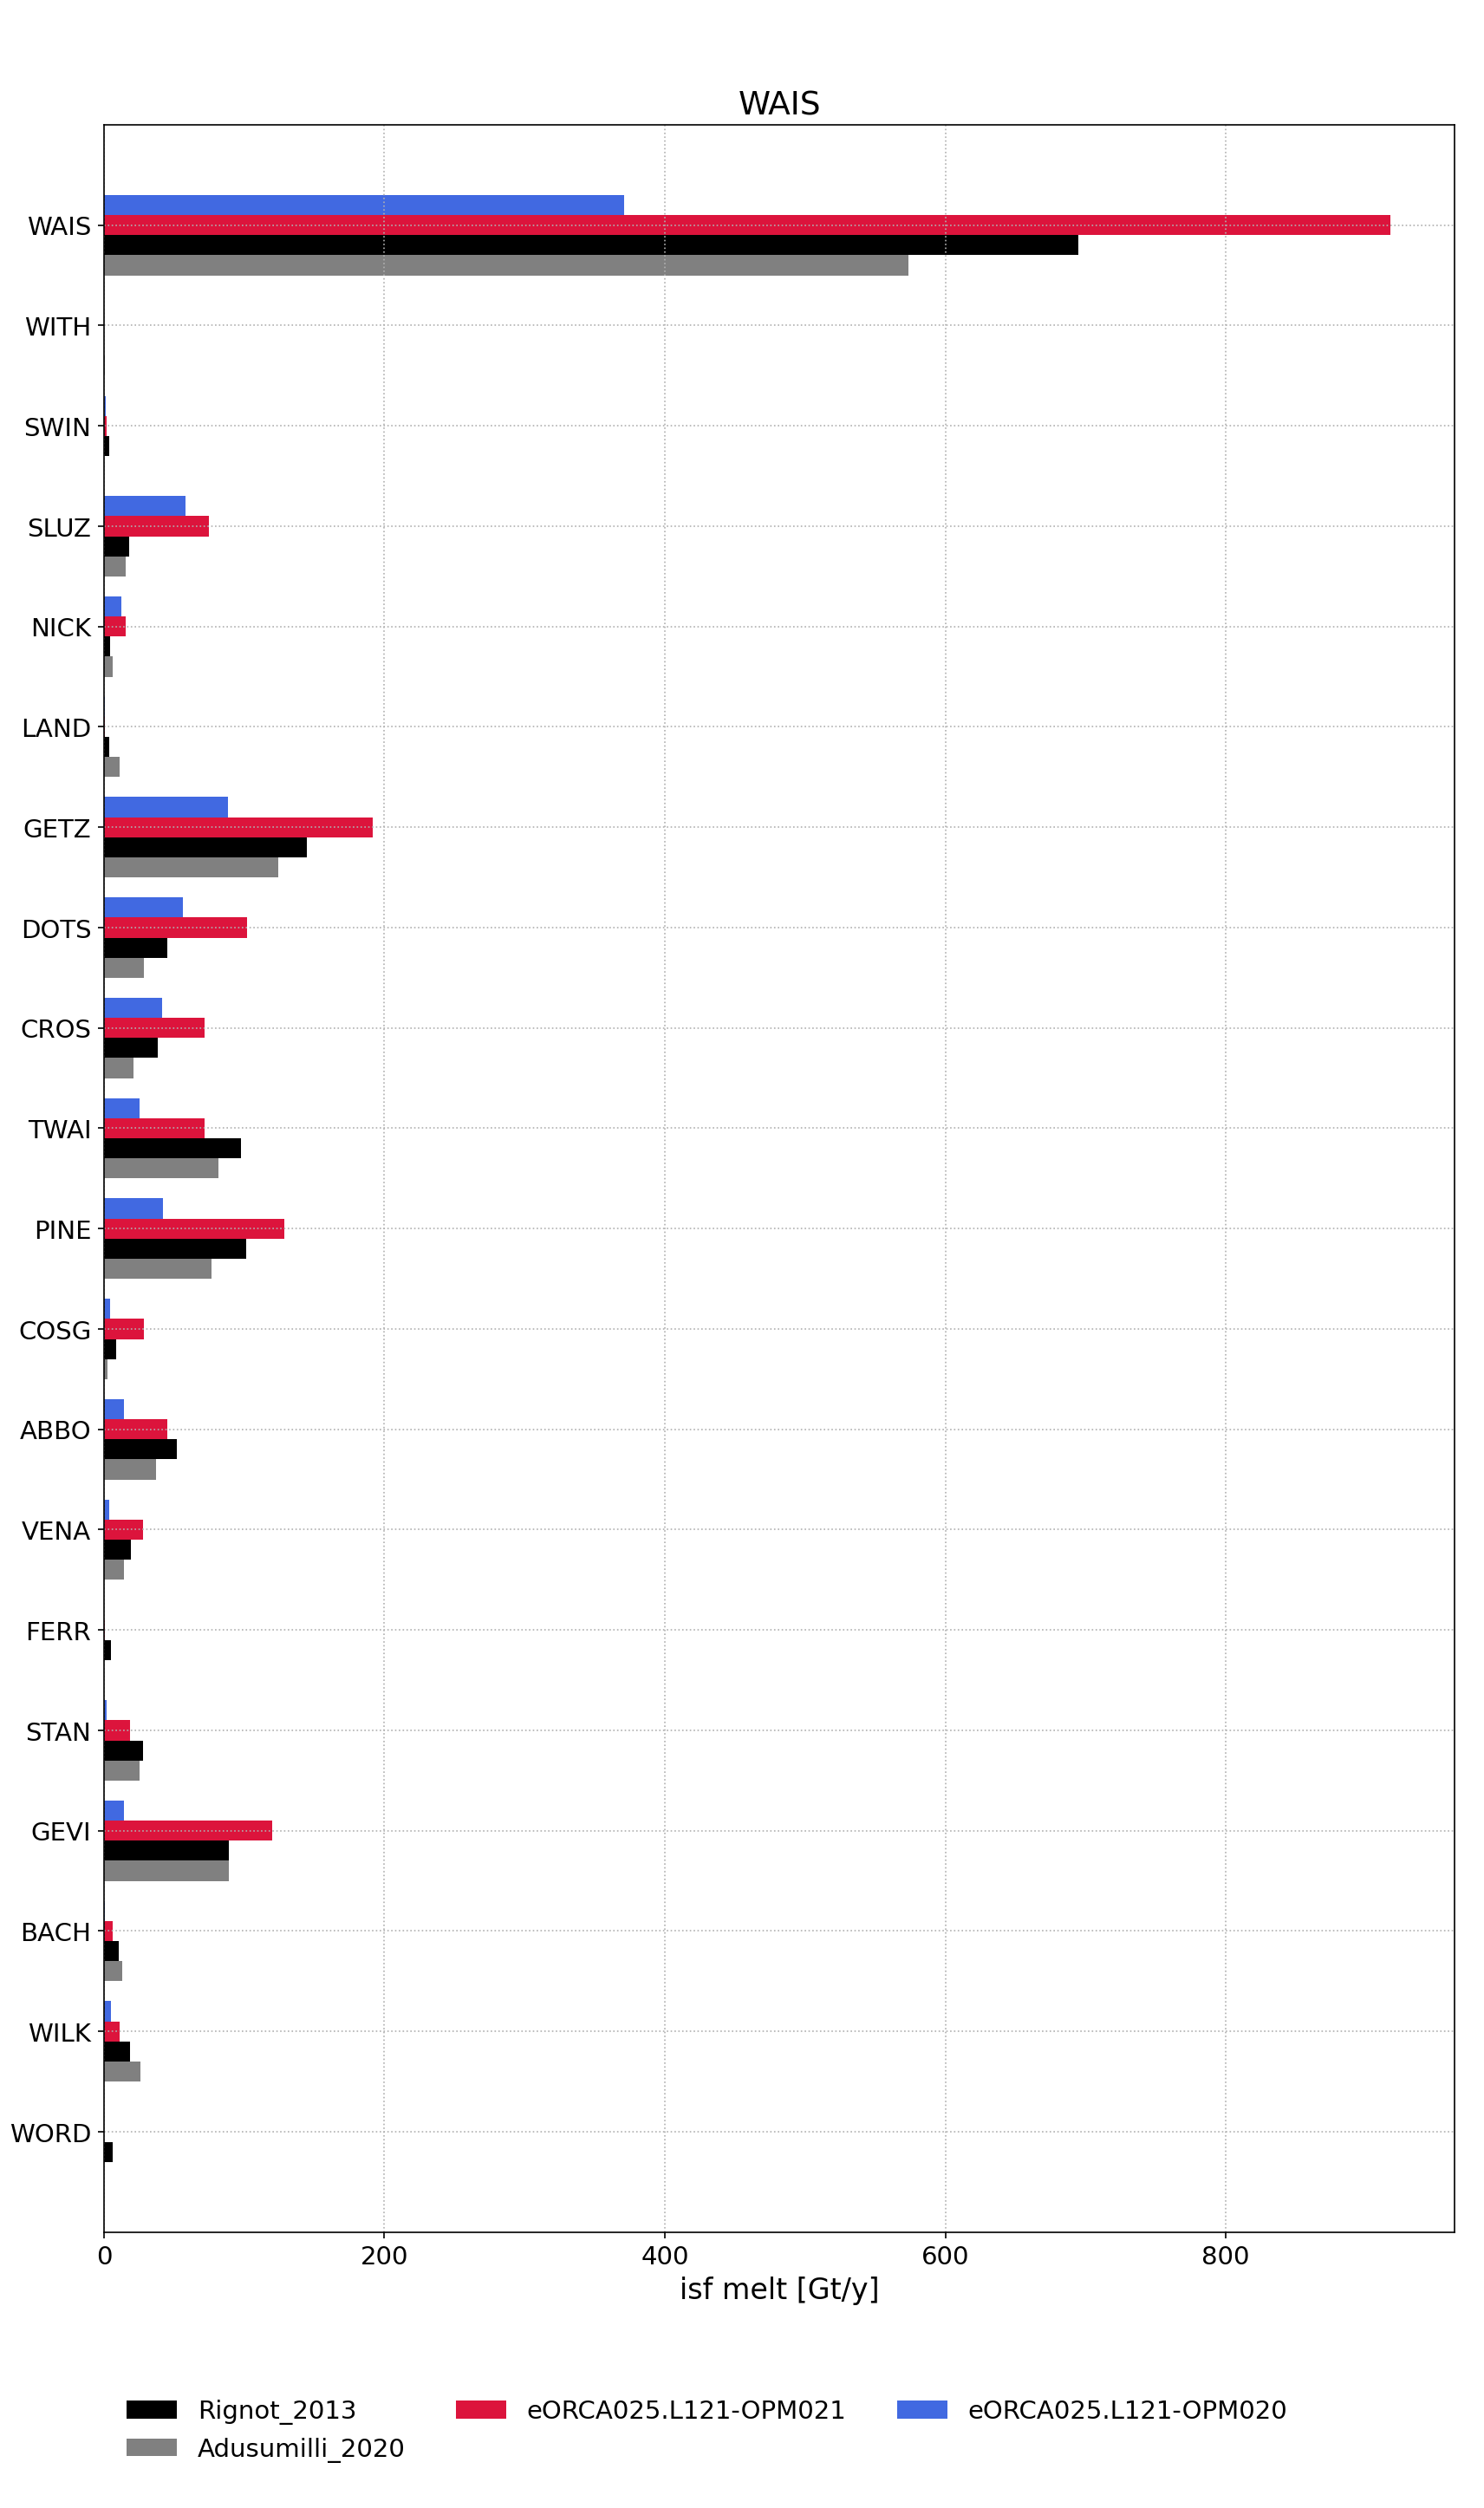
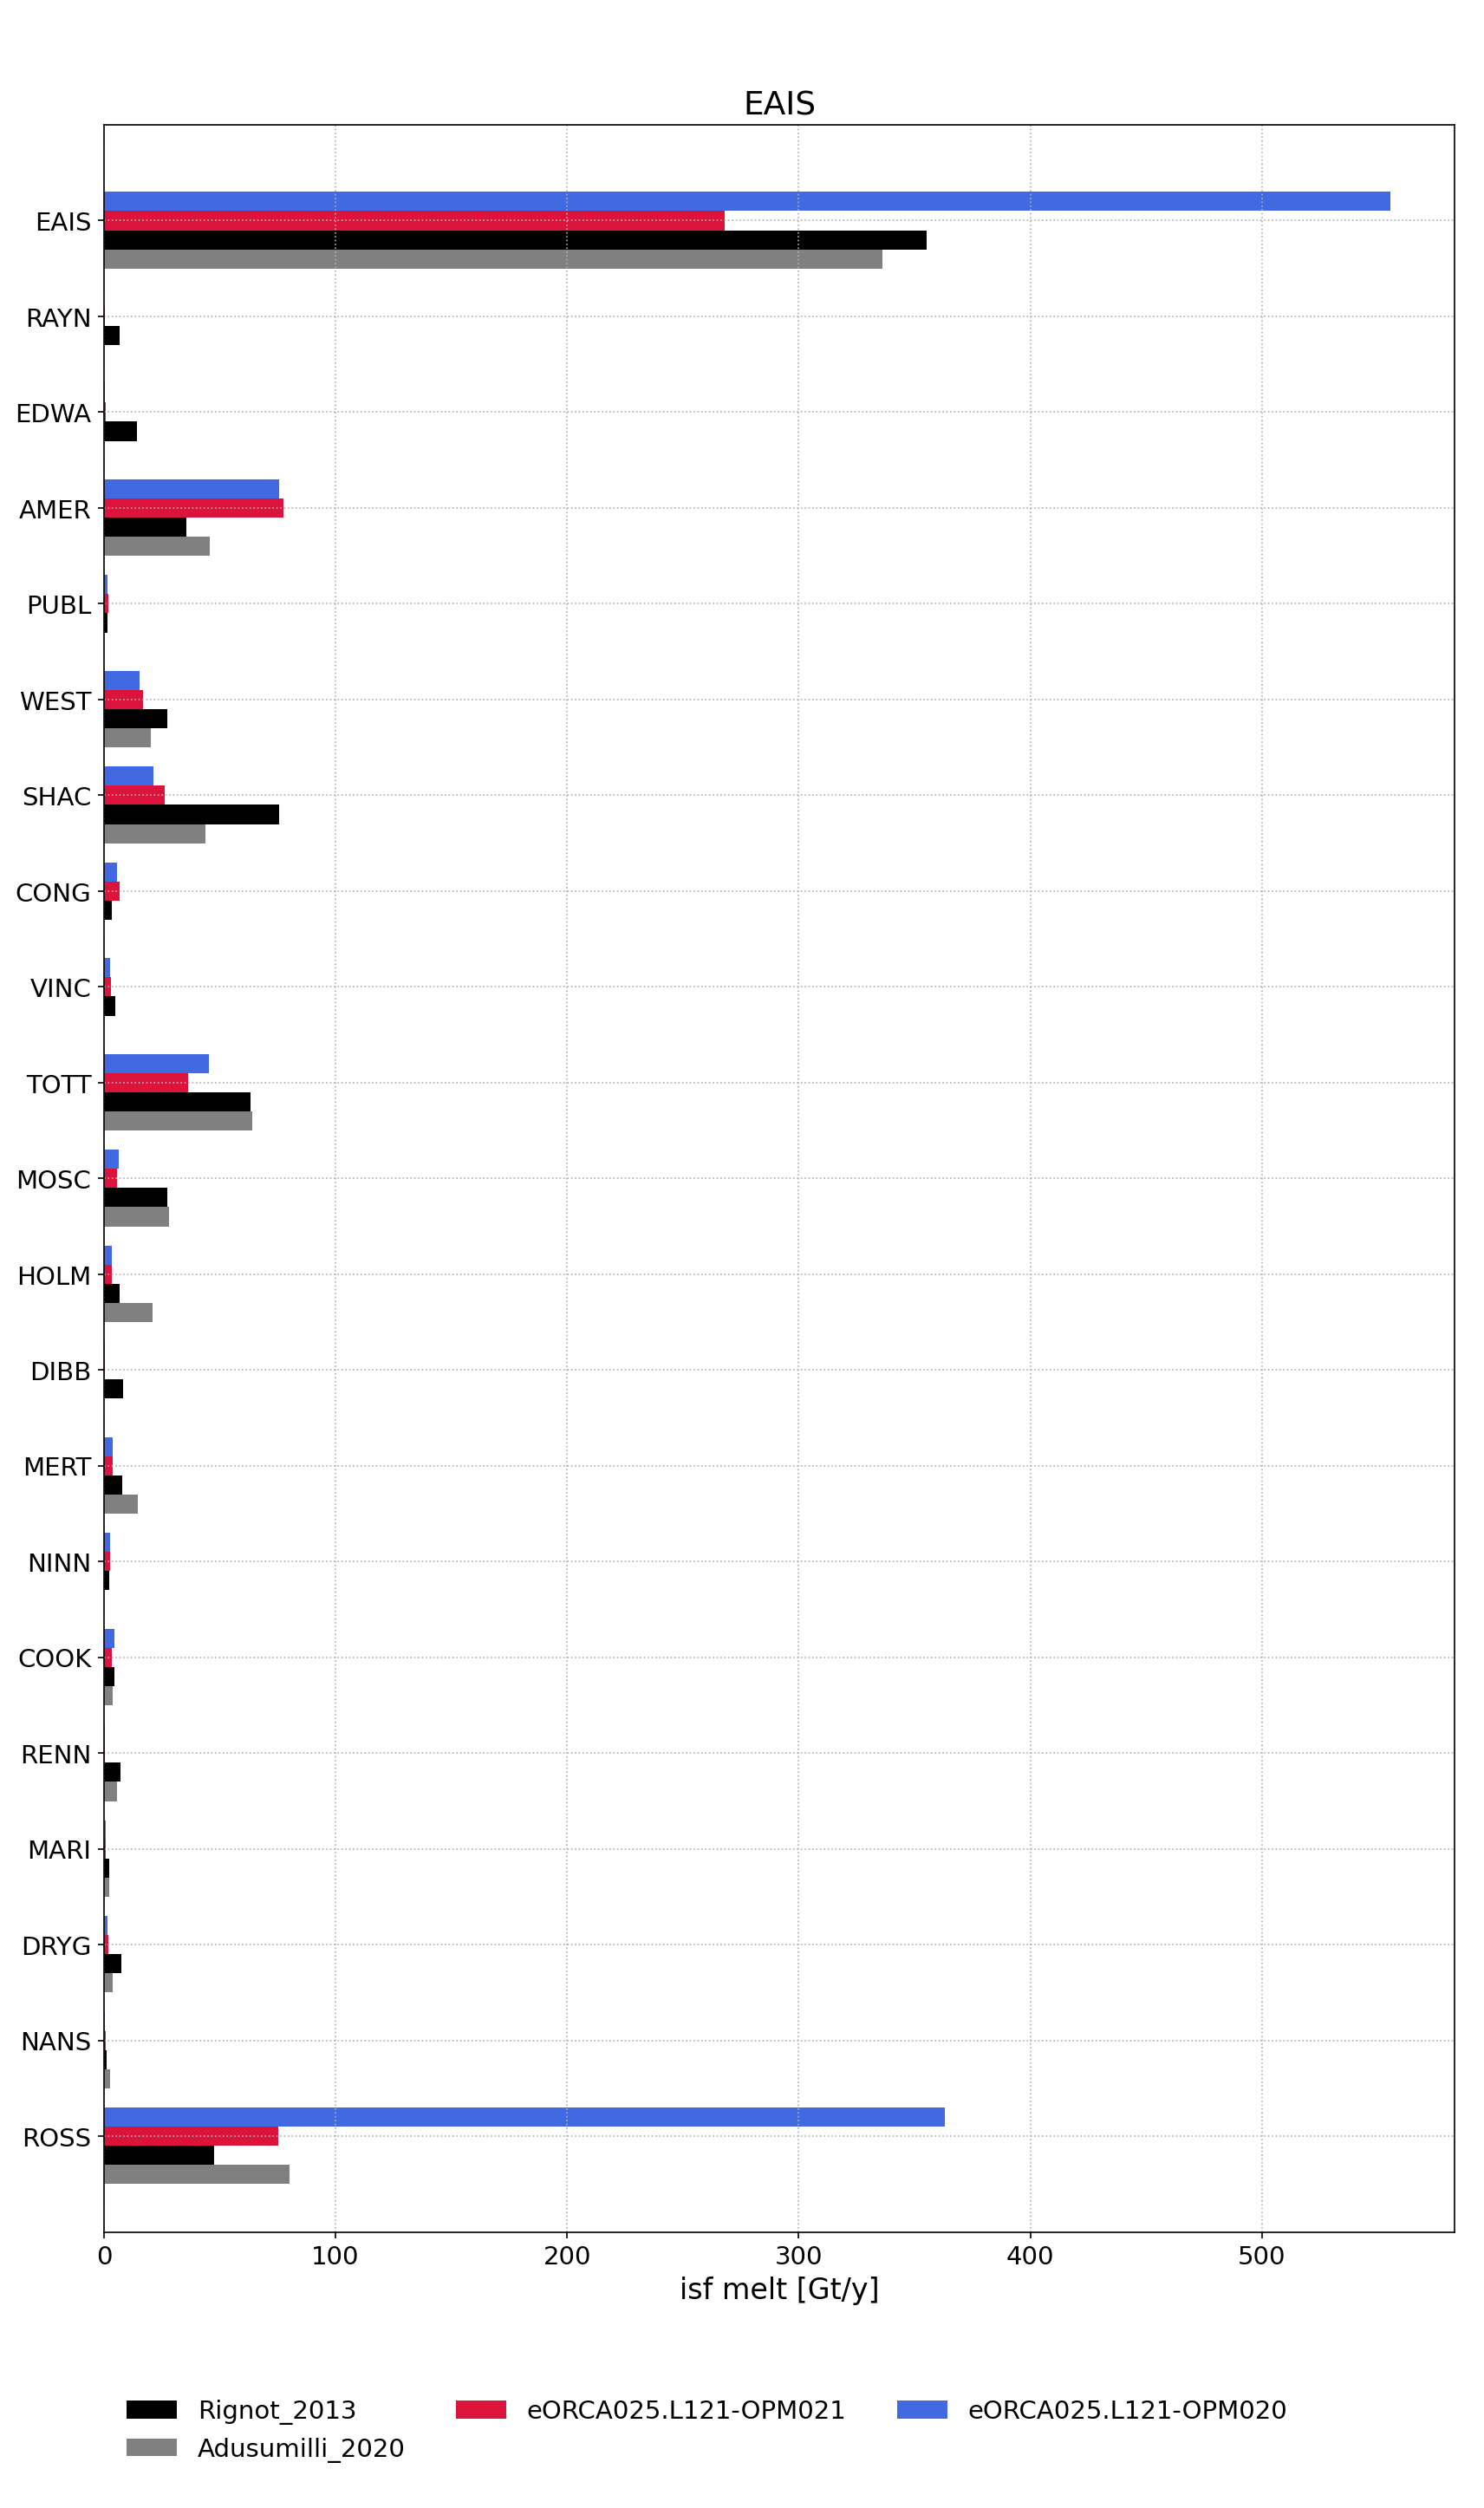
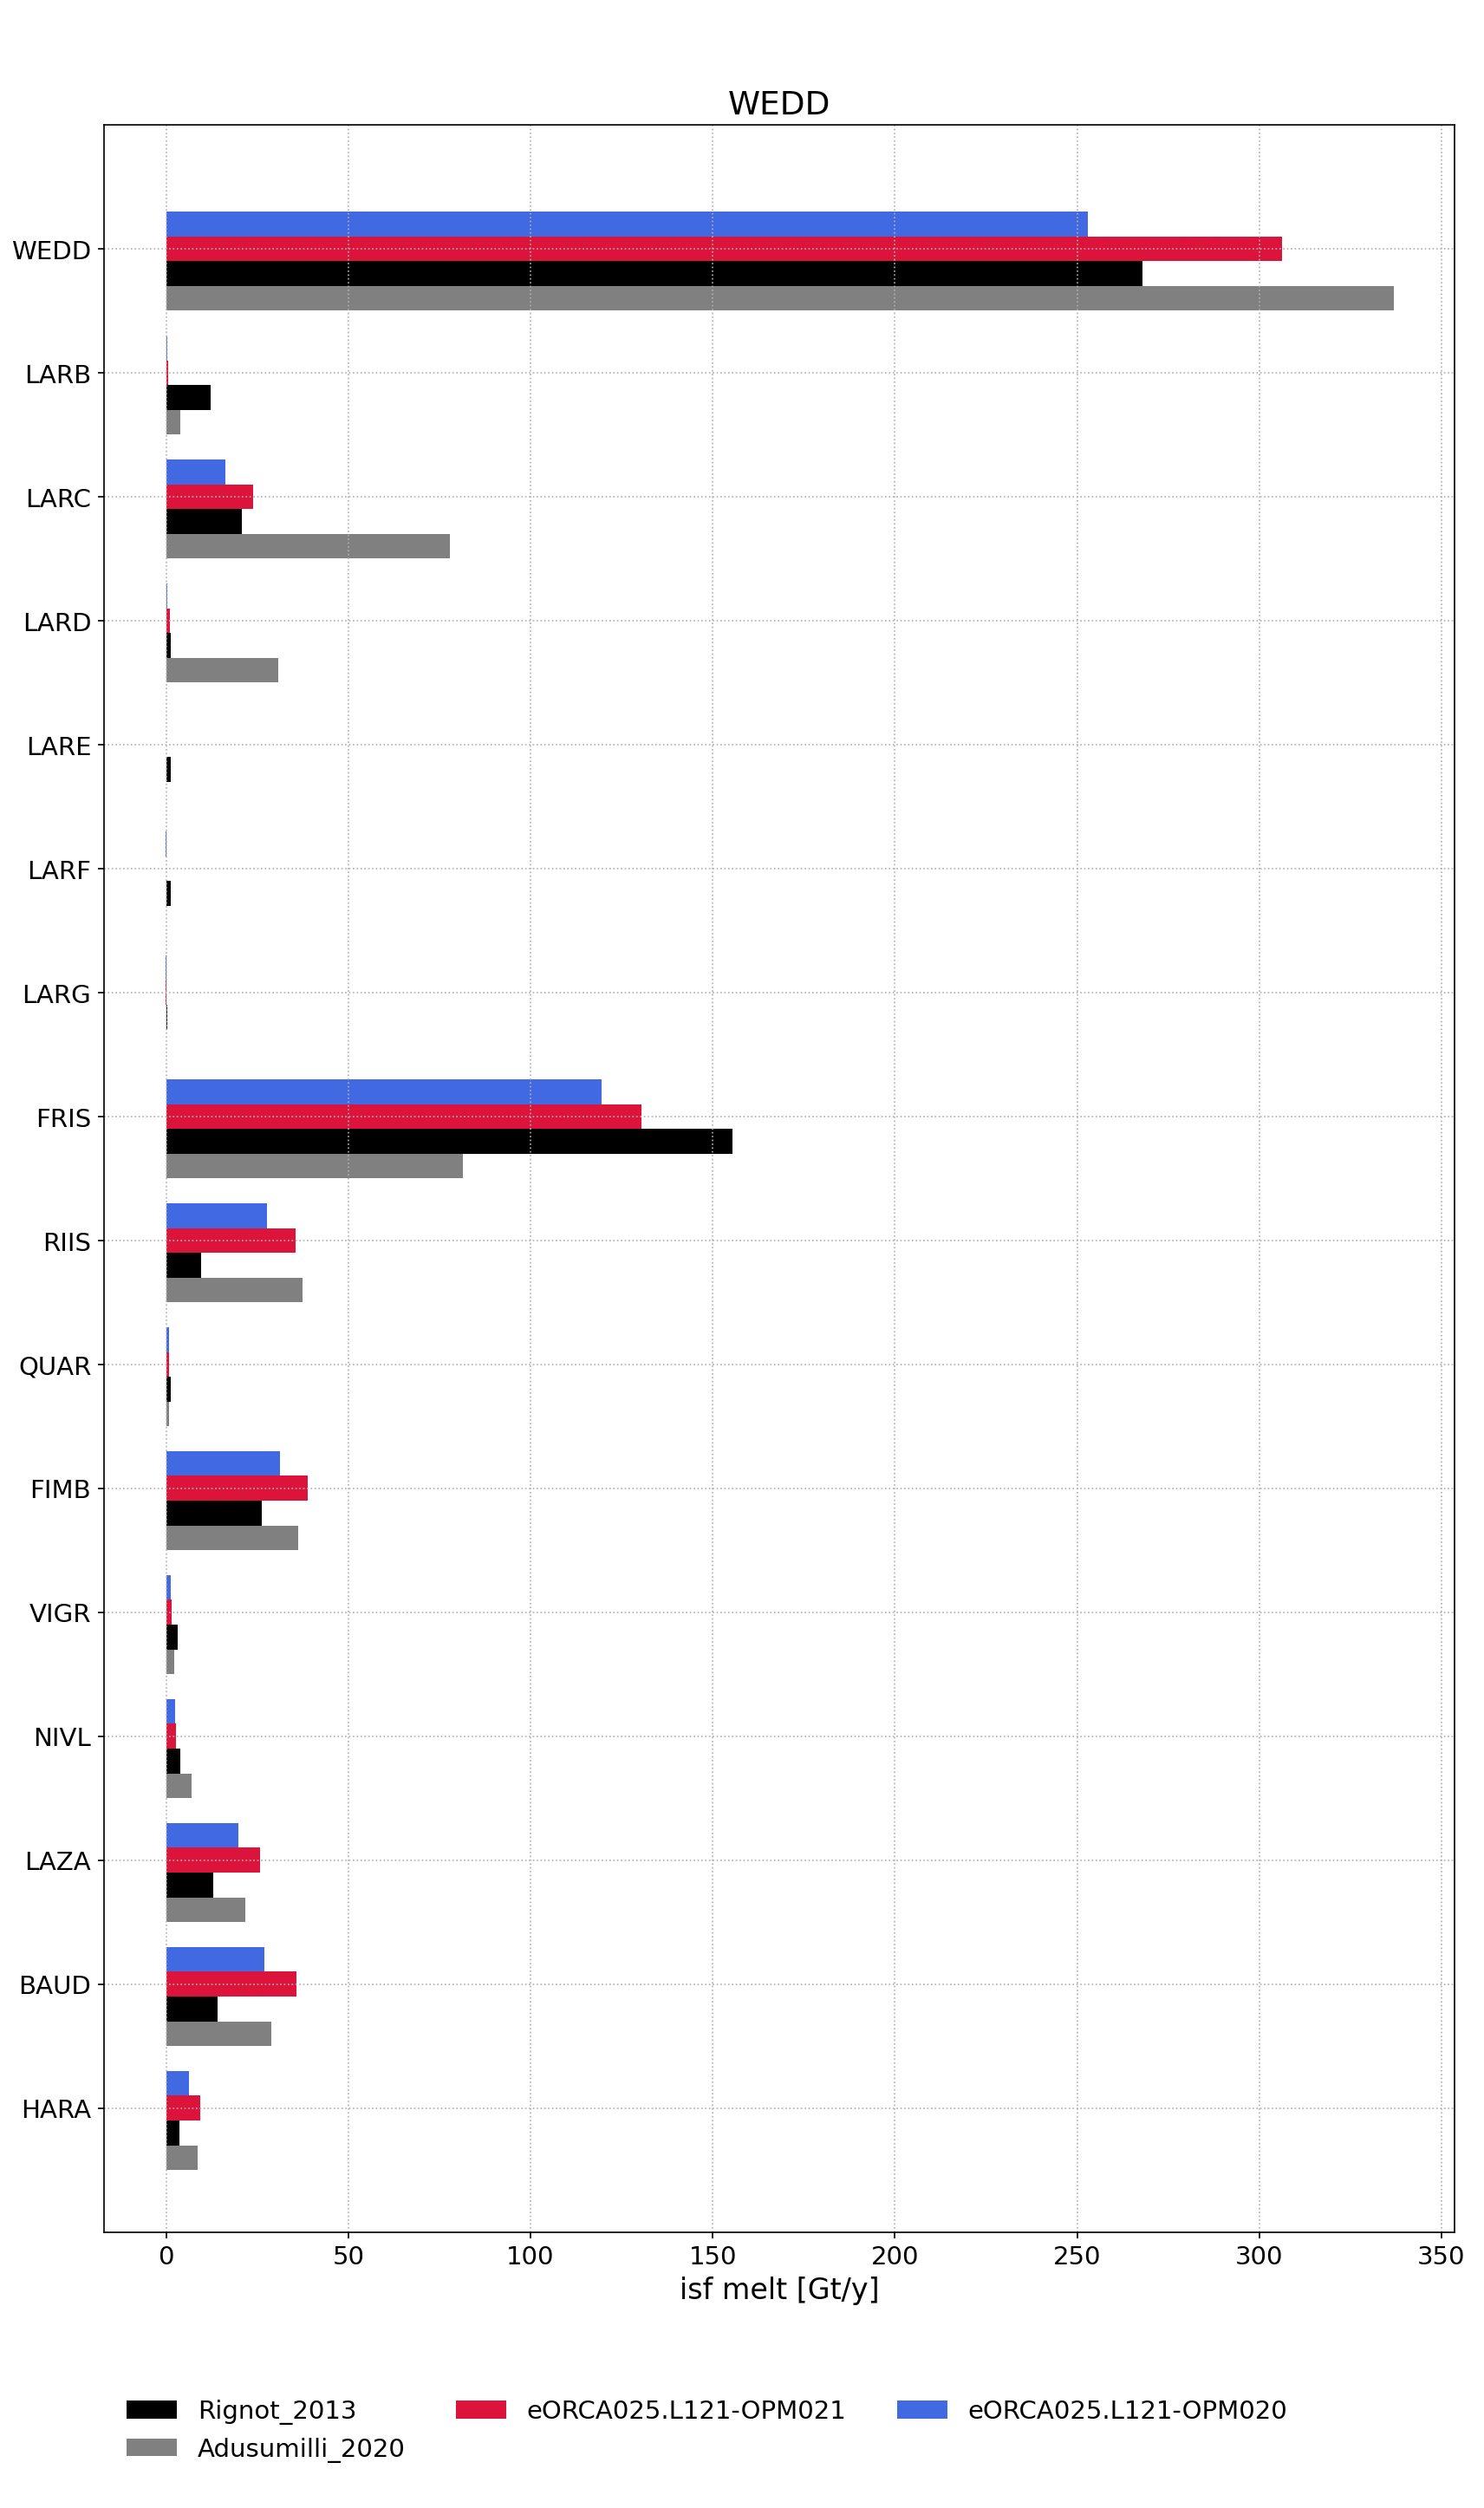
Evaluation
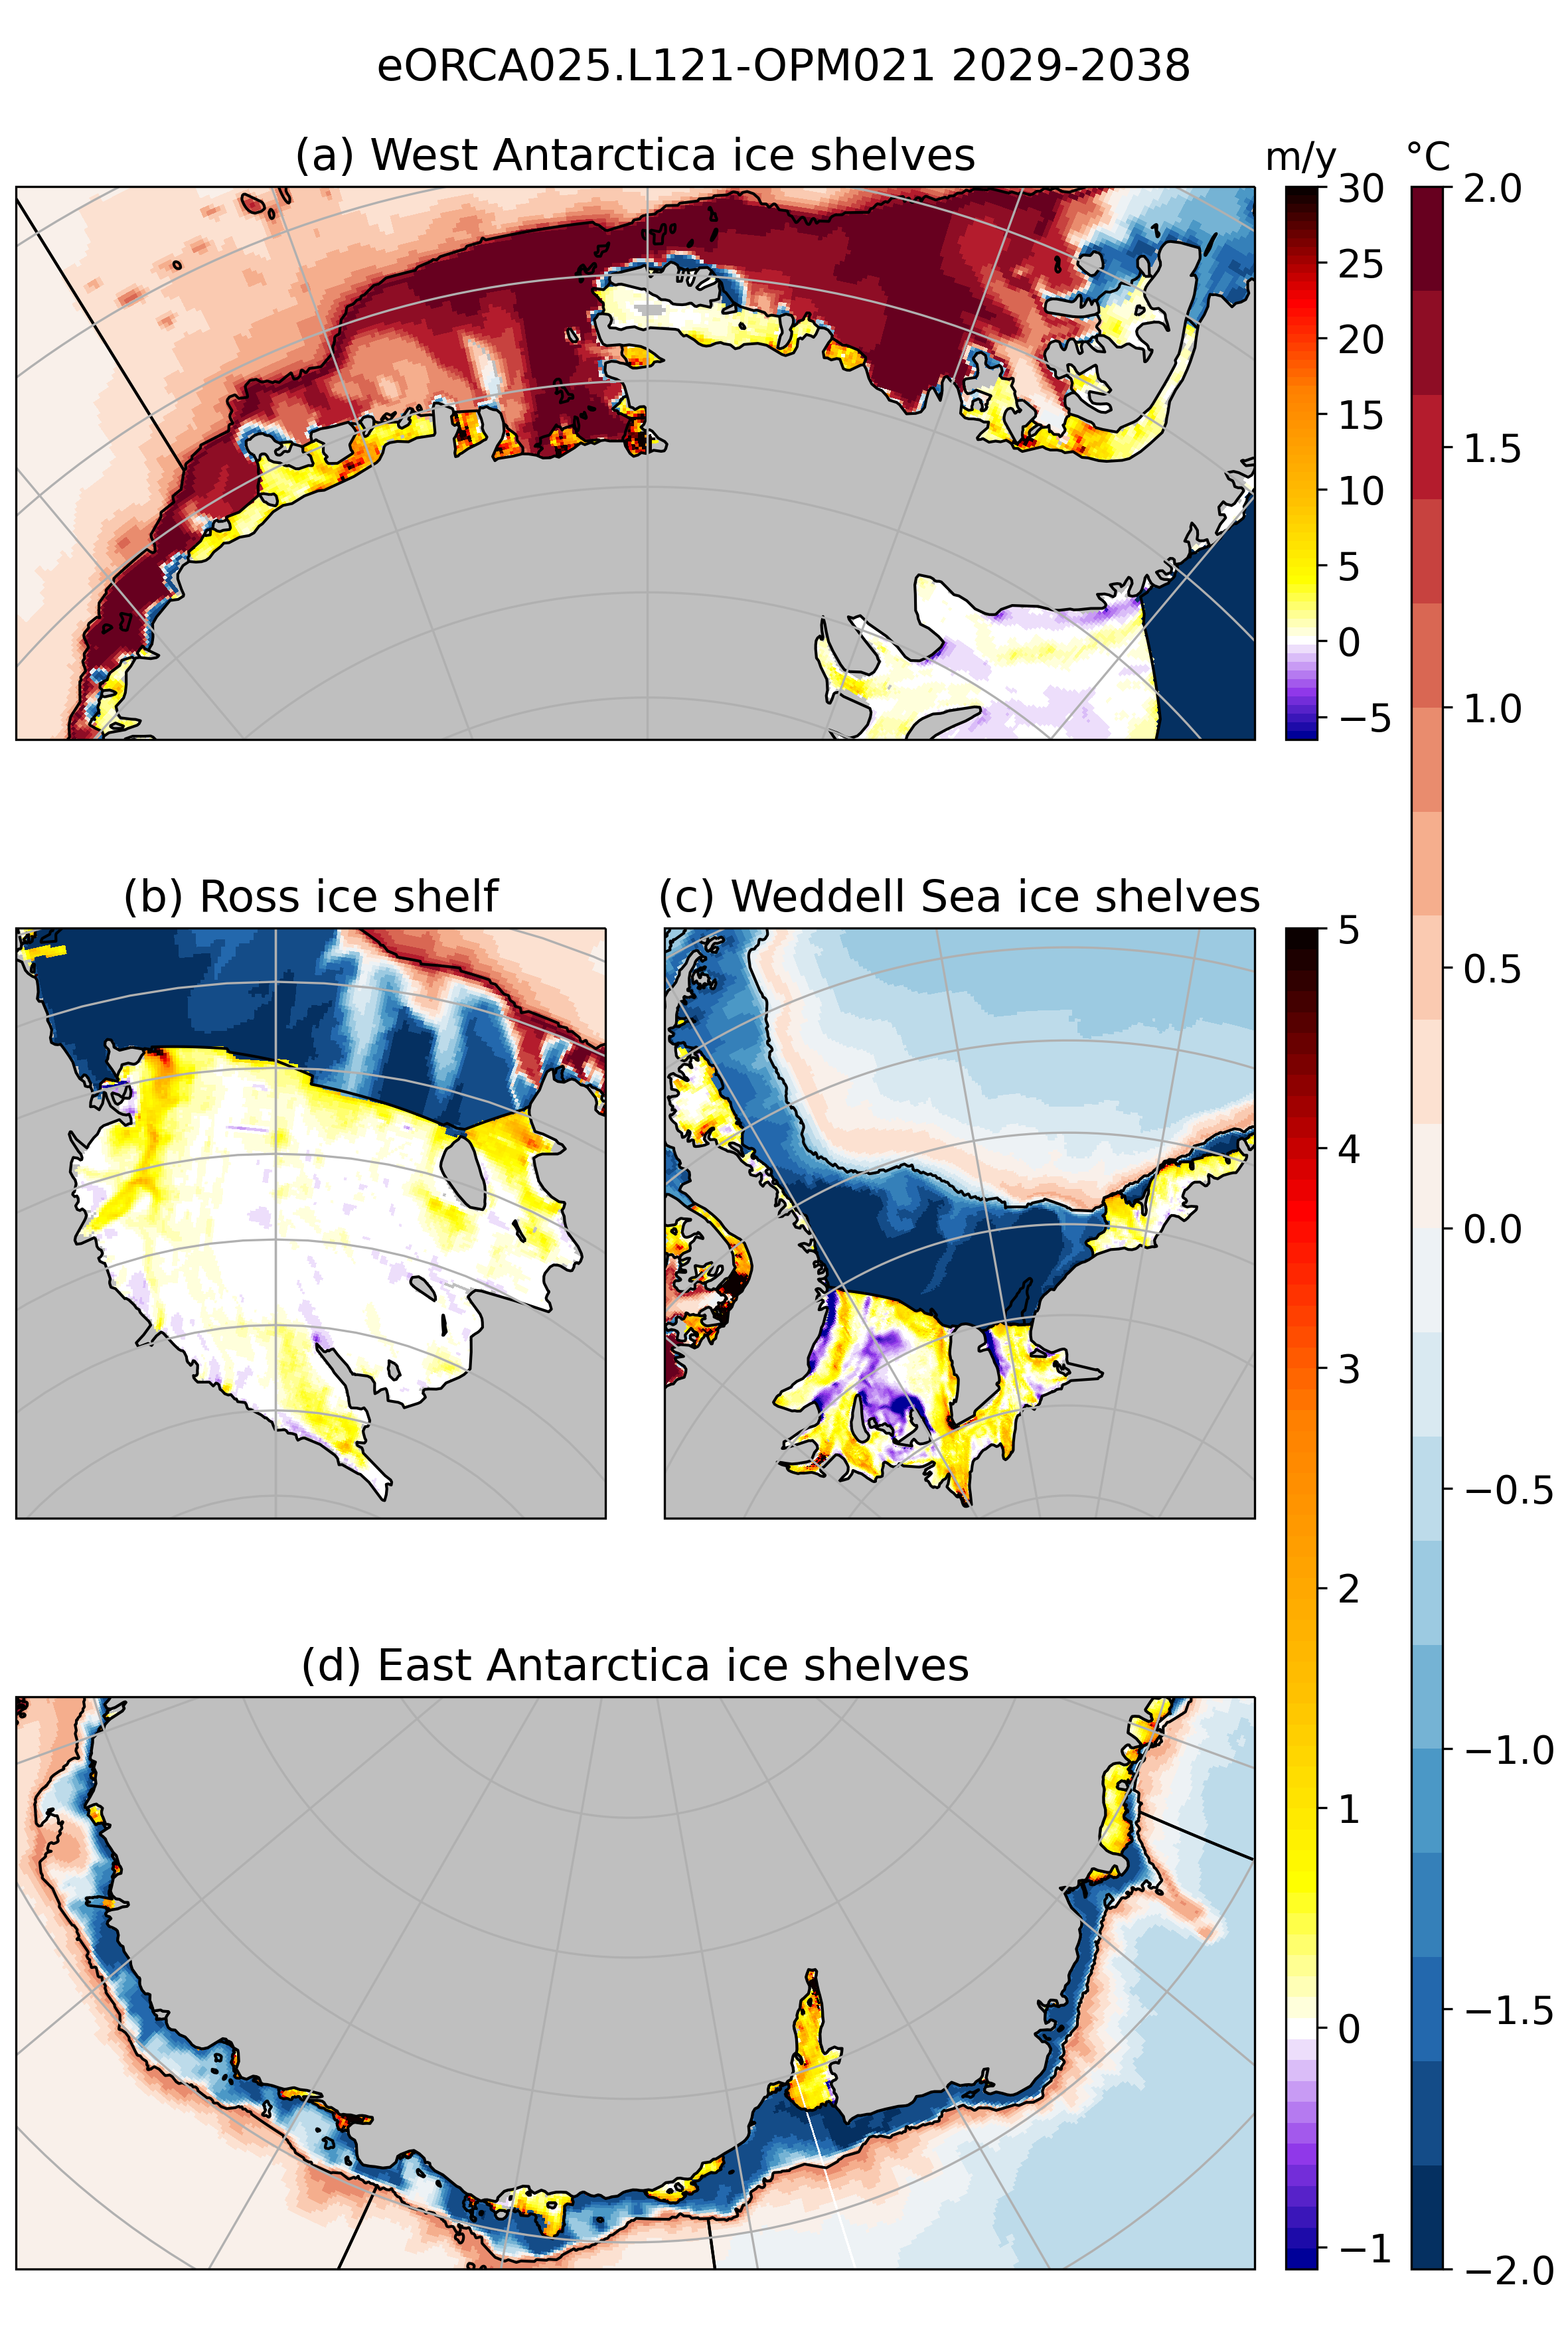
Ice shelf melt: the pictures below are the climatological melt for all the ice shelves in NEMO for the OPM020 and OPM021 simulations over the last decade of the simulations (2029-2038) by sectors.
Map of ice shelf melt for both simulations OPM020 and OPM021 over the last decade of the simulations (2029-2038) with bottom temperature.

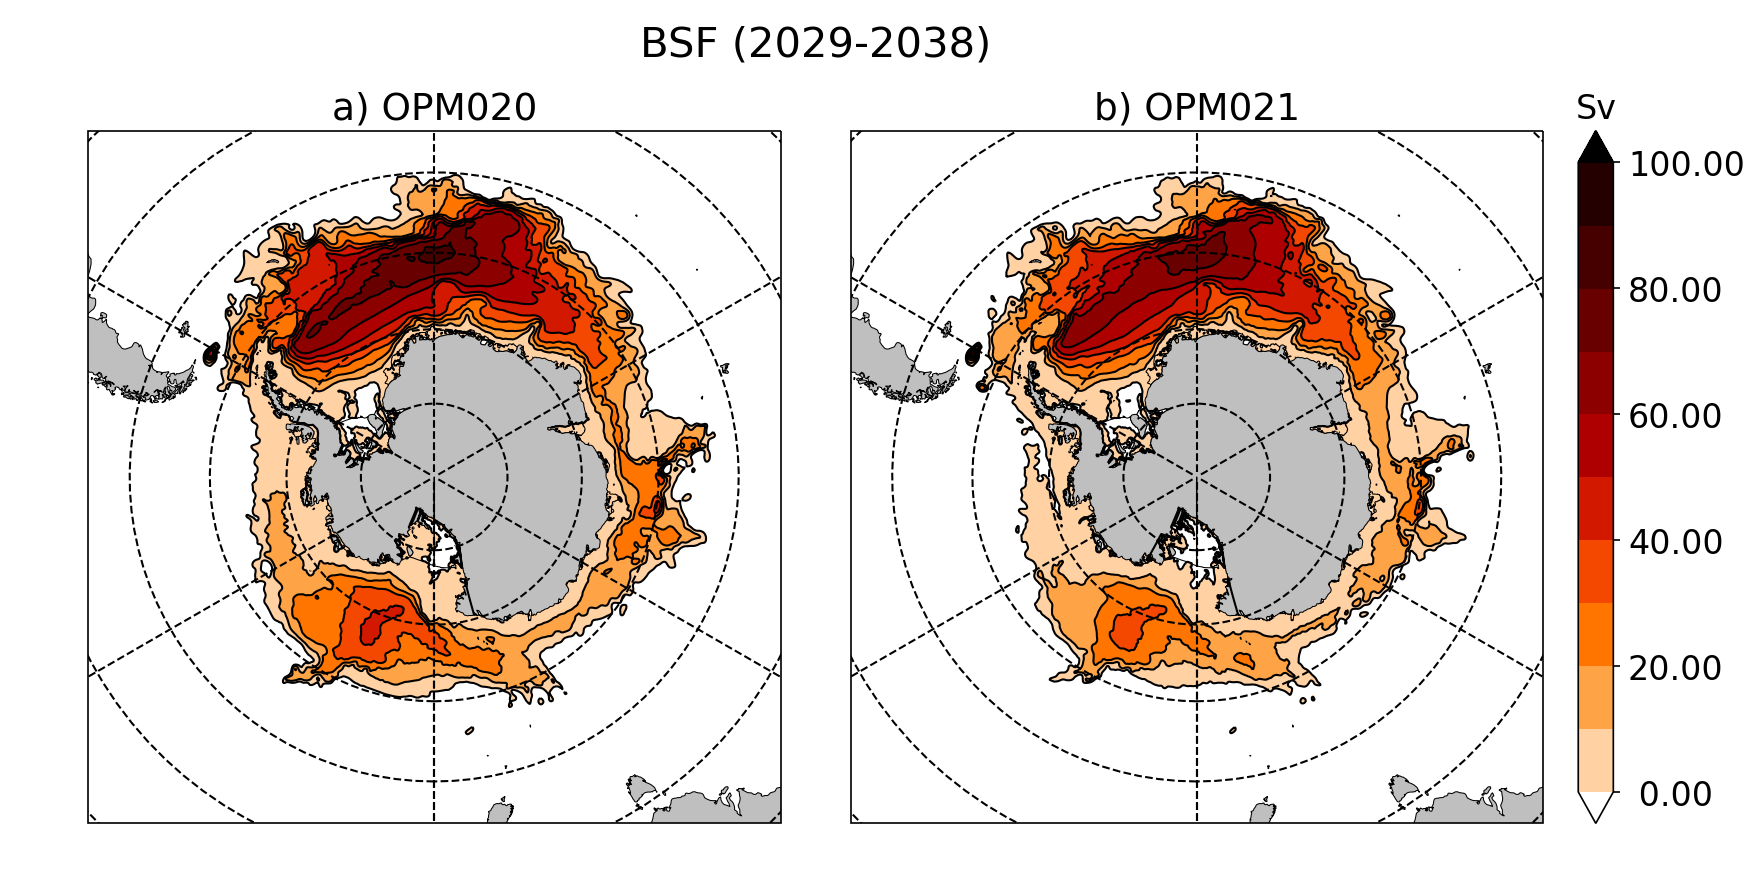
Map of barotropic stream function for both simulations OPM020 and OPM021 over the last decade of the simulations (2029-2038)