eORCA025.L121-OPM026
Summary
Compare to eORCA025.L121-OPM021, we improve the model behavior at the tip of Antarctic Peninsula and sss restoring is applied as a corretion from 021 run.
Input files
All the inputs files needed to run this configuration are here: https://ige-meom-opendap.univ-grenoble-alpes.fr/thredds/catalog/meomopendap/extract/eORCA025.L121/eORCA025.L121-OPM026/catalog.html?dataset=meomscanpublic/eORCA025.L121/eORCA025.L121-OPM026/eORCA025.L121-OPM026_input.tar
A detailed description of each file is given in eORCA025 input files
Namelist
Only the change compare to the reference (eORCA025.L121-OPM021) are mentioned in the next sections.
Full files are available here: https://github.com/pmathiot/NEMOCFG/tree/main/cfgs/eORCA025.L121-OPM026/cfgs/eORCA025.L121-OPM026/EXPREF
namelist_oce
in order to have clean comparison later on,
we enforce the restoring term to be a specified corrective term of emp (nn_ssr = 3, need code changes wrt NEMO distri). In this case sssr output from eORCA021.L121-OPM021 is used.
!-----------------------------------------------------------------------
&namsbc_ssr    !   surface boundary condition : sea surface restoring   (ln_ssr =T)
!-----------------------------------------------------------------------
   nn_sstr     =     0     !  add a retroaction term to the surface heat flux (=1) or not (=0)
      rn_dqdt     = -40.      !  magnitude of the retroaction on temperature   [W/m2/K]
   nn_sssr     =     3     !  add a damping term to the surface freshwater flux (=2)
      !                    !  or to SSS only (=1) or no damping term (=0) or read from a file (=3)
      rn_deds     =  -166.67  !  magnitude of the damping on salinity   [mm/day]
      ln_sssr_bnd =  .true.   !  flag to bound erp term (associated with nn_sssr=2)
      rn_sssr_bnd =   4.e0    !  ABS(Max/Min) value of the damping erp term [mm/day]

      nn_sssr_ice =   1       ! control of sea surface restoring under sea-ice
                              ! 0 = no restoration under ice : * (1-icefrac)
                              ! 1 = restoration everywhere
                              ! >1 = enhanced restoration under ice : 1+(nn_icedmp-1)*icefrac
   cn_dir      = './'      !  root directory for the SST/SSS data location
   !___________!_________________________!___________________!___________!_____________!________!___________!___________!__________!_______________!
   !           !  file name              ! frequency (hours) ! variable  ! time interp.!  clim  ! 'yearly'/ ! weights e ! rotation ! land/sea mask !
   !           !                         !  (if <0  months)  !   name    !   (logical) !  (T/F) ! 'monthly' !  filename ! pairing  !    filename   !
   sn_sst      = 'NOT_USED.nc'           ,        24.        ,  'sst'    ,    .false.  , .false., 'yearly'  ,    ''     ,    ''    ,     ''
   sn_sss      = 'eORCA025_sss_WOA2018_c3.0_v19812010.5.1'  , -1. , 'sosaline' , .true. , .true. , 'yearly' ,  ''     ,    ''    ,     ''
/
!-----------------------------------------------------------------------
&namsbc_ssr_drk !   surface boundary condition : sea surface restoring   (ln_ssr =T)
!-----------------------------------------------------------------------
   ln_sssr_flt  = .false.  ! use filtering of SSS model for sss restoring
   nn_shap_iter =  300     ! number of iteration of the shapiro filter
   ln_sssr_msk  = .true.   ! use a mask near the coast
   !___________!____________________!___________________!__________!_____________!________!___________!__________!__________!_______________!
   !           !  file name         ! frequency (hours) ! variable ! time interp.!  clim  ! 'yearly'/ ! weights  ! rotation ! land/sea mask !
   !           !                    !  (if <0  months)  !   name   !   (logical) !  (T/F) ! 'monthly' ! filename ! pairing  !    filename   !
   sn_coast    = 'eORCA025_distcoast_b0.2_v0.0' ,  0.   , 'Tcoast' , .false.     , .true. , 'yearly'  ,  ''      , ''       , ''
   sn_empc     = 'eORCA025.L121-OPM021_y1999.1m.20y_flxT', -1. , 'sowafld'  , .true. , .true. , 'yearly' ,  ''     ,    ''    ,     ''

   rn_dist    =  150.      ! distance to the coast
/
namelist_ice
in order to increase the sea ice production,
we decrease the max sea ice fraction in the SH from 0.997 to 0.95 (same number as in IPCLCM6_LR)
!------------------------------------------------------------------------------
&nampar         !   Generic parameters
!------------------------------------------------------------------------------
   jpl              =   5             !  number of ice  categories
   nlay_i           =   2             !  number of ice  layers
   nlay_s           =   1             !  number of snow layers (only 1 is working)
   ln_virtual_itd   =   .false.       !  virtual ITD mono-category parameterization (jpl=1 only)
                                      !     i.e. enhanced thermal conductivity & virtual thin ice melting
   ln_icedyn        = .true.          !  ice dynamics (T) or not (F)
   ln_icethd        = .true.          !  ice thermo   (T) or not (F)
   rn_amax_n        =   0.997         !  maximum tolerated ice concentration NH
   rn_amax_s        =   0.95          !  maximum tolerated ice concentration SH
   cn_icerst_in     = "restart_ice"   !  suffix of ice restart name (input)
   cn_icerst_out    = "restart_ice"   !  suffix of ice restart name (output)
   cn_icerst_indir  = "<CN_DIRRST>"   !  directory to read   input ice restarts
   cn_icerst_outdir = "<CN_DIRRST>"   !  directory to write output ice restarts
/
Input files
Use eORCA025.L121_domain_cfg_b0.5_c3.0_d1.0.nc instead of eORCA025.L121_domain_cfg_b0.3_c3.0_d1.0.nc
Use eORCA025_shlat2d_v0.2.nc instead of eORCA025_shlat2d_v0.0.nc
Use eORCA025_bfr2d_v0.2.nc instead of eORCA025_bfr2d_v0.0.nc
Code changes
sbcssr.F90 has been changed to include possibilities to prescribed a correction on emp based on previous run sssr output.
Full files are available here: https://github.com/pmathiot/NEMOCFG/tree/main/cfgs/eORCA025.L121-OPM026/src/
Monitoring
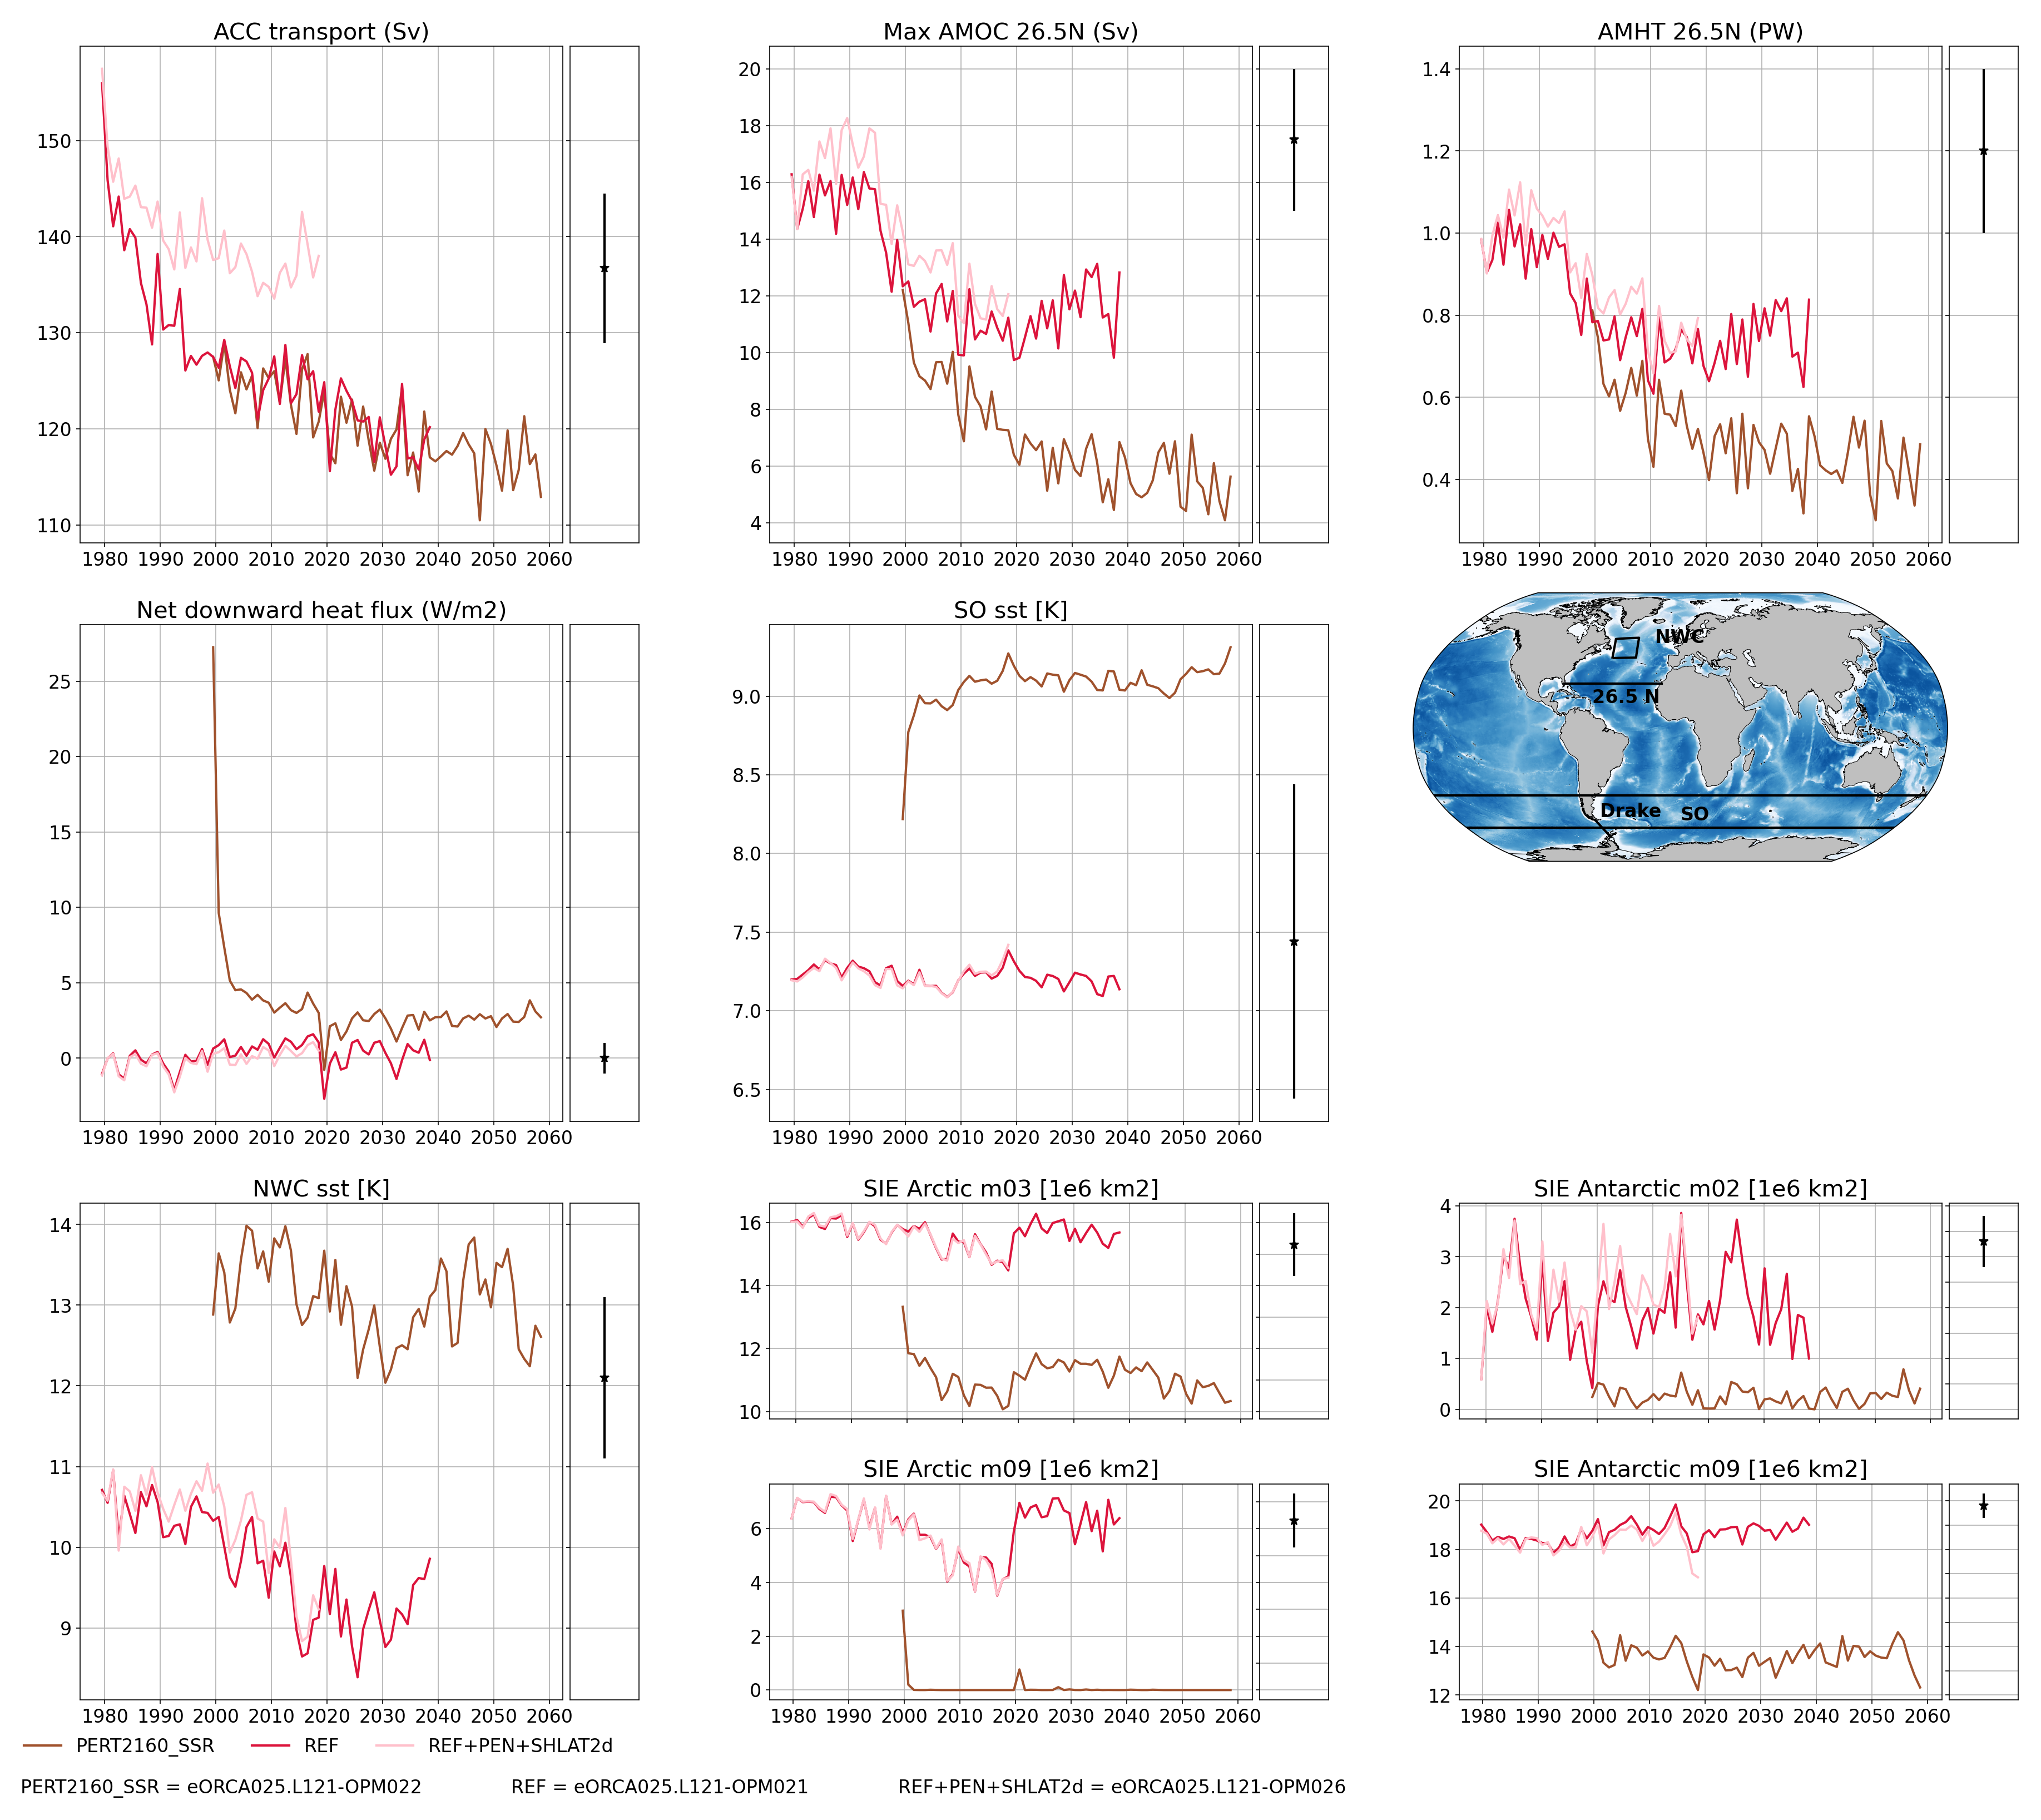
Global indicators
On these plot you can find a time series of:
ACC transport
AMOC at rapid array
AMHT at rapid array
Net global heat fluxes
mean sst in the southern ocean (see box in the map)
mean sst in the North West Corner (see box in the map)
sea ice extent (arctic/ant in summer/winter)
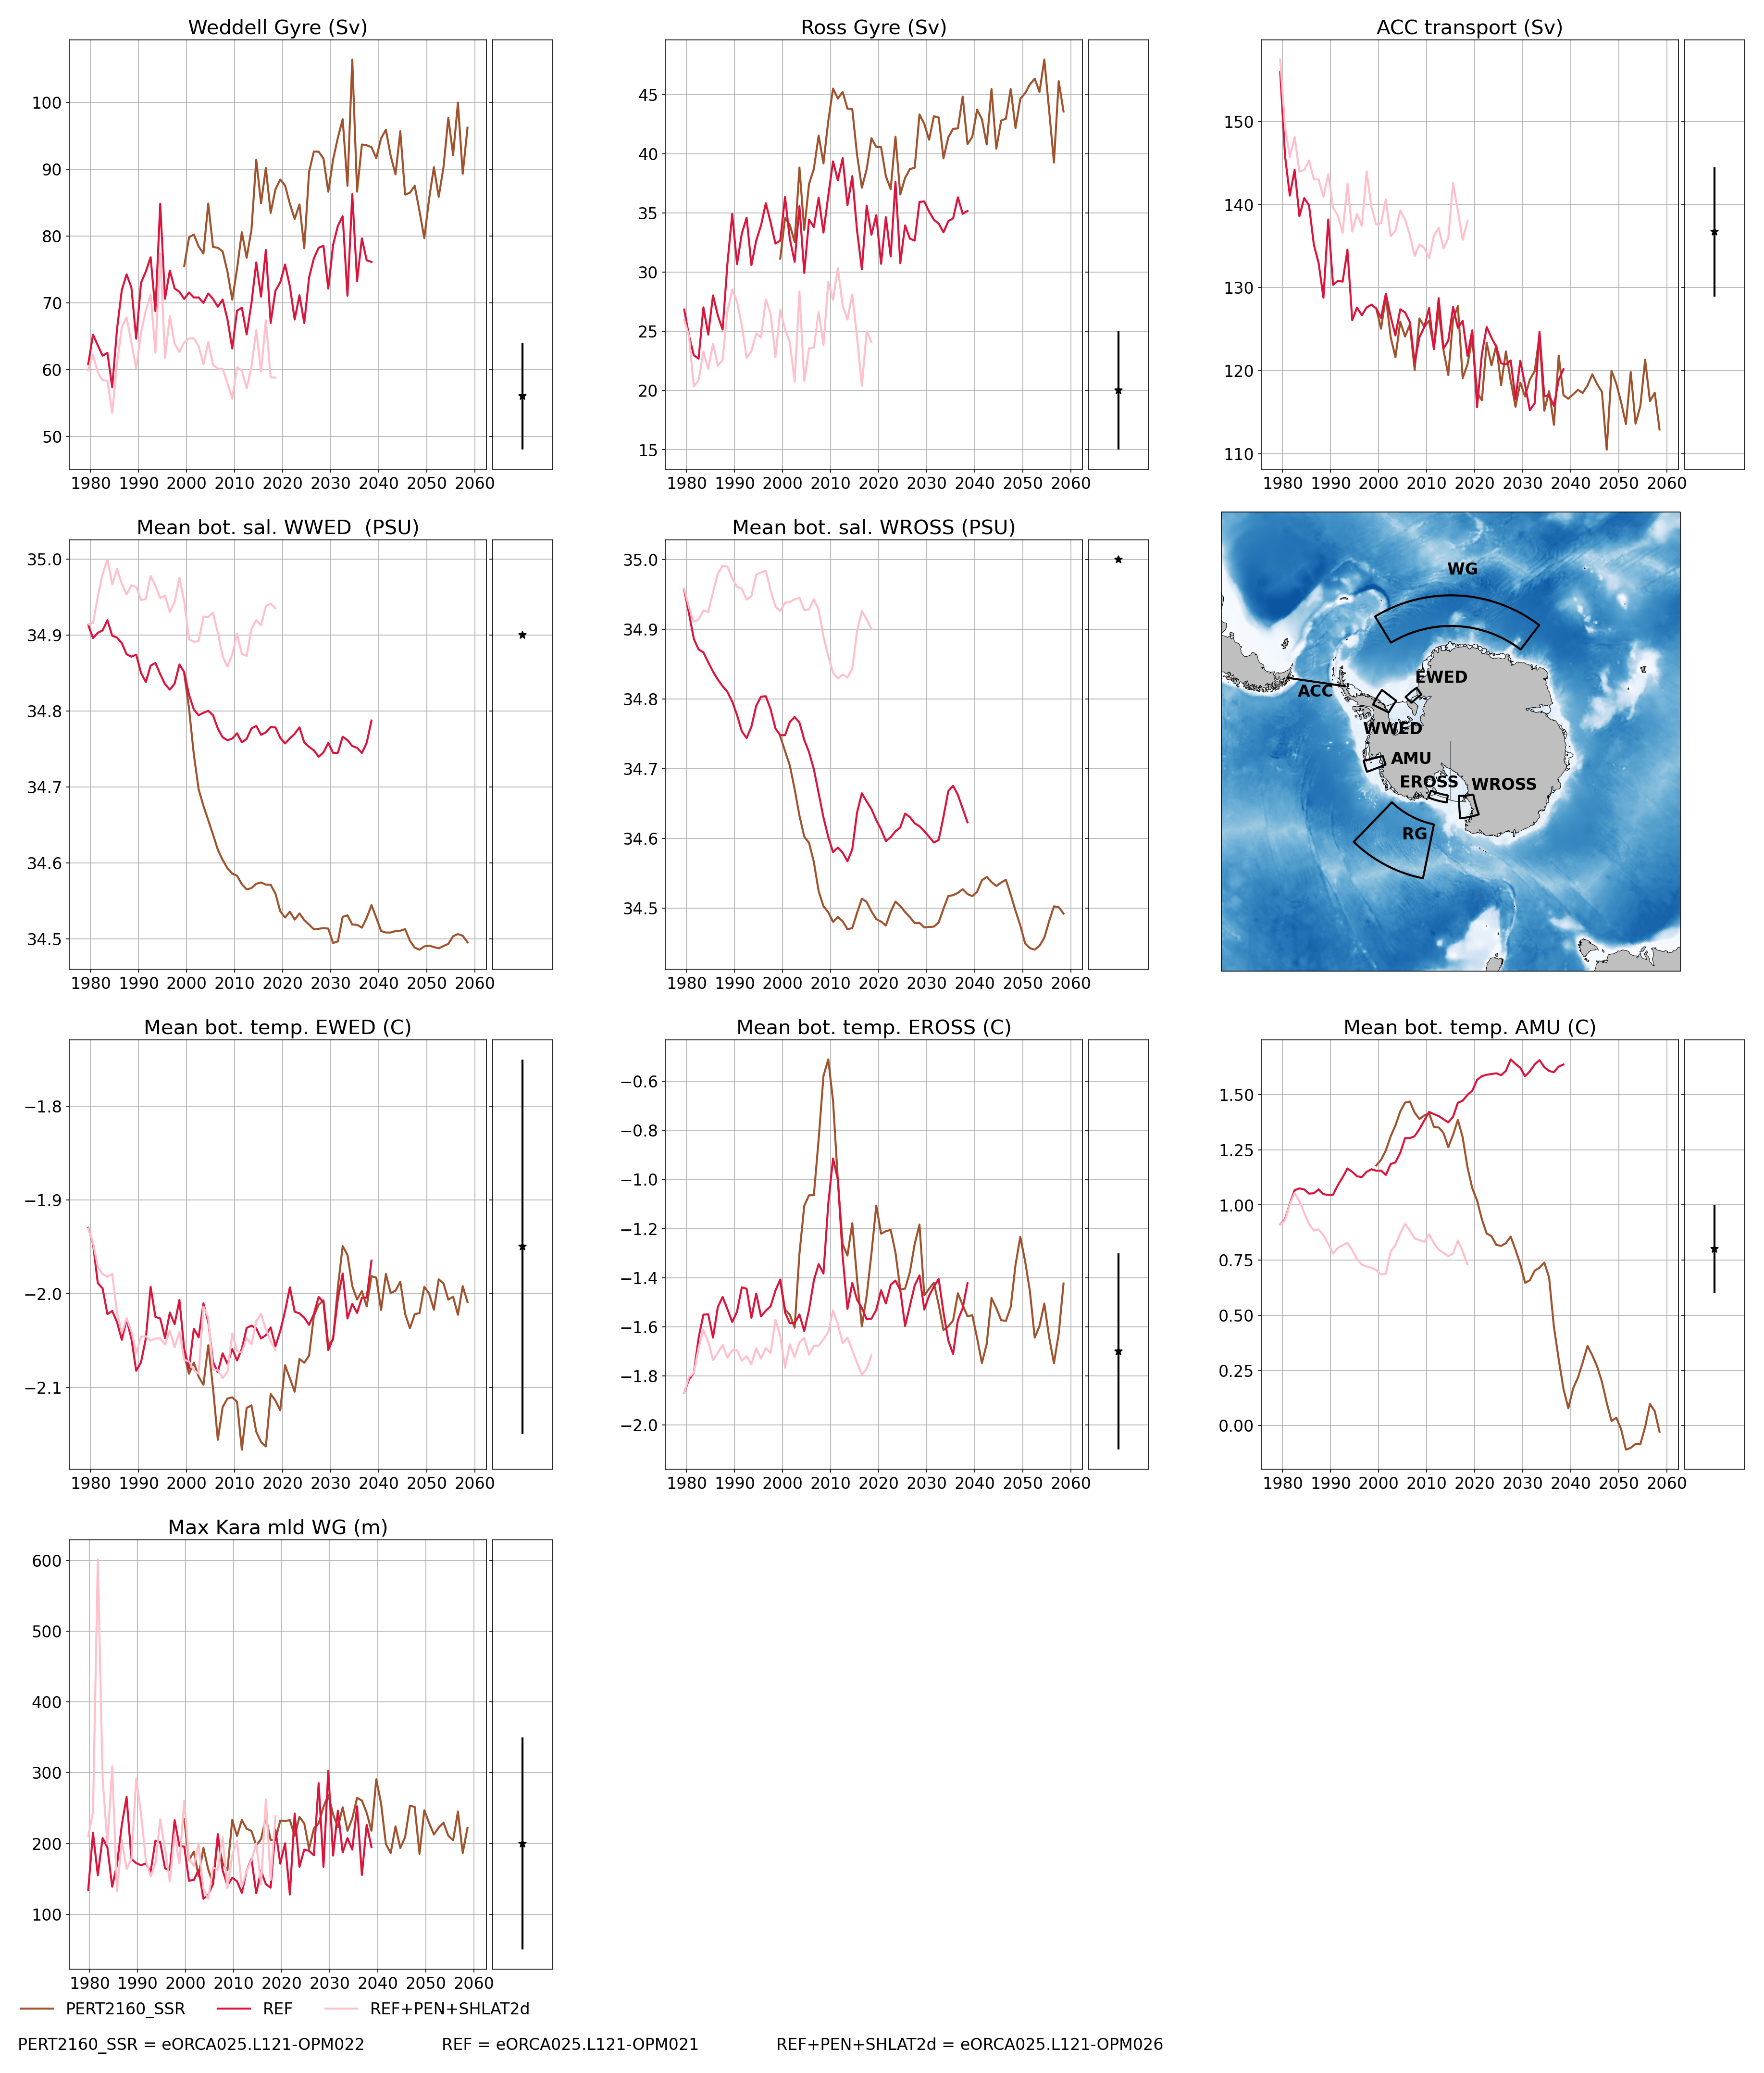
Regional indicators
On these plot, you can find time series of:
ACC transport
Maximum of the Weddell and Ross Gyre (box where the max compute show in the map)
Mean bottom salinity over the main dense water formation hot spot (West Ross and West FRIS)
Mean bottom temperature over East Ross and Amudsen sea to monitor CDW intrusion
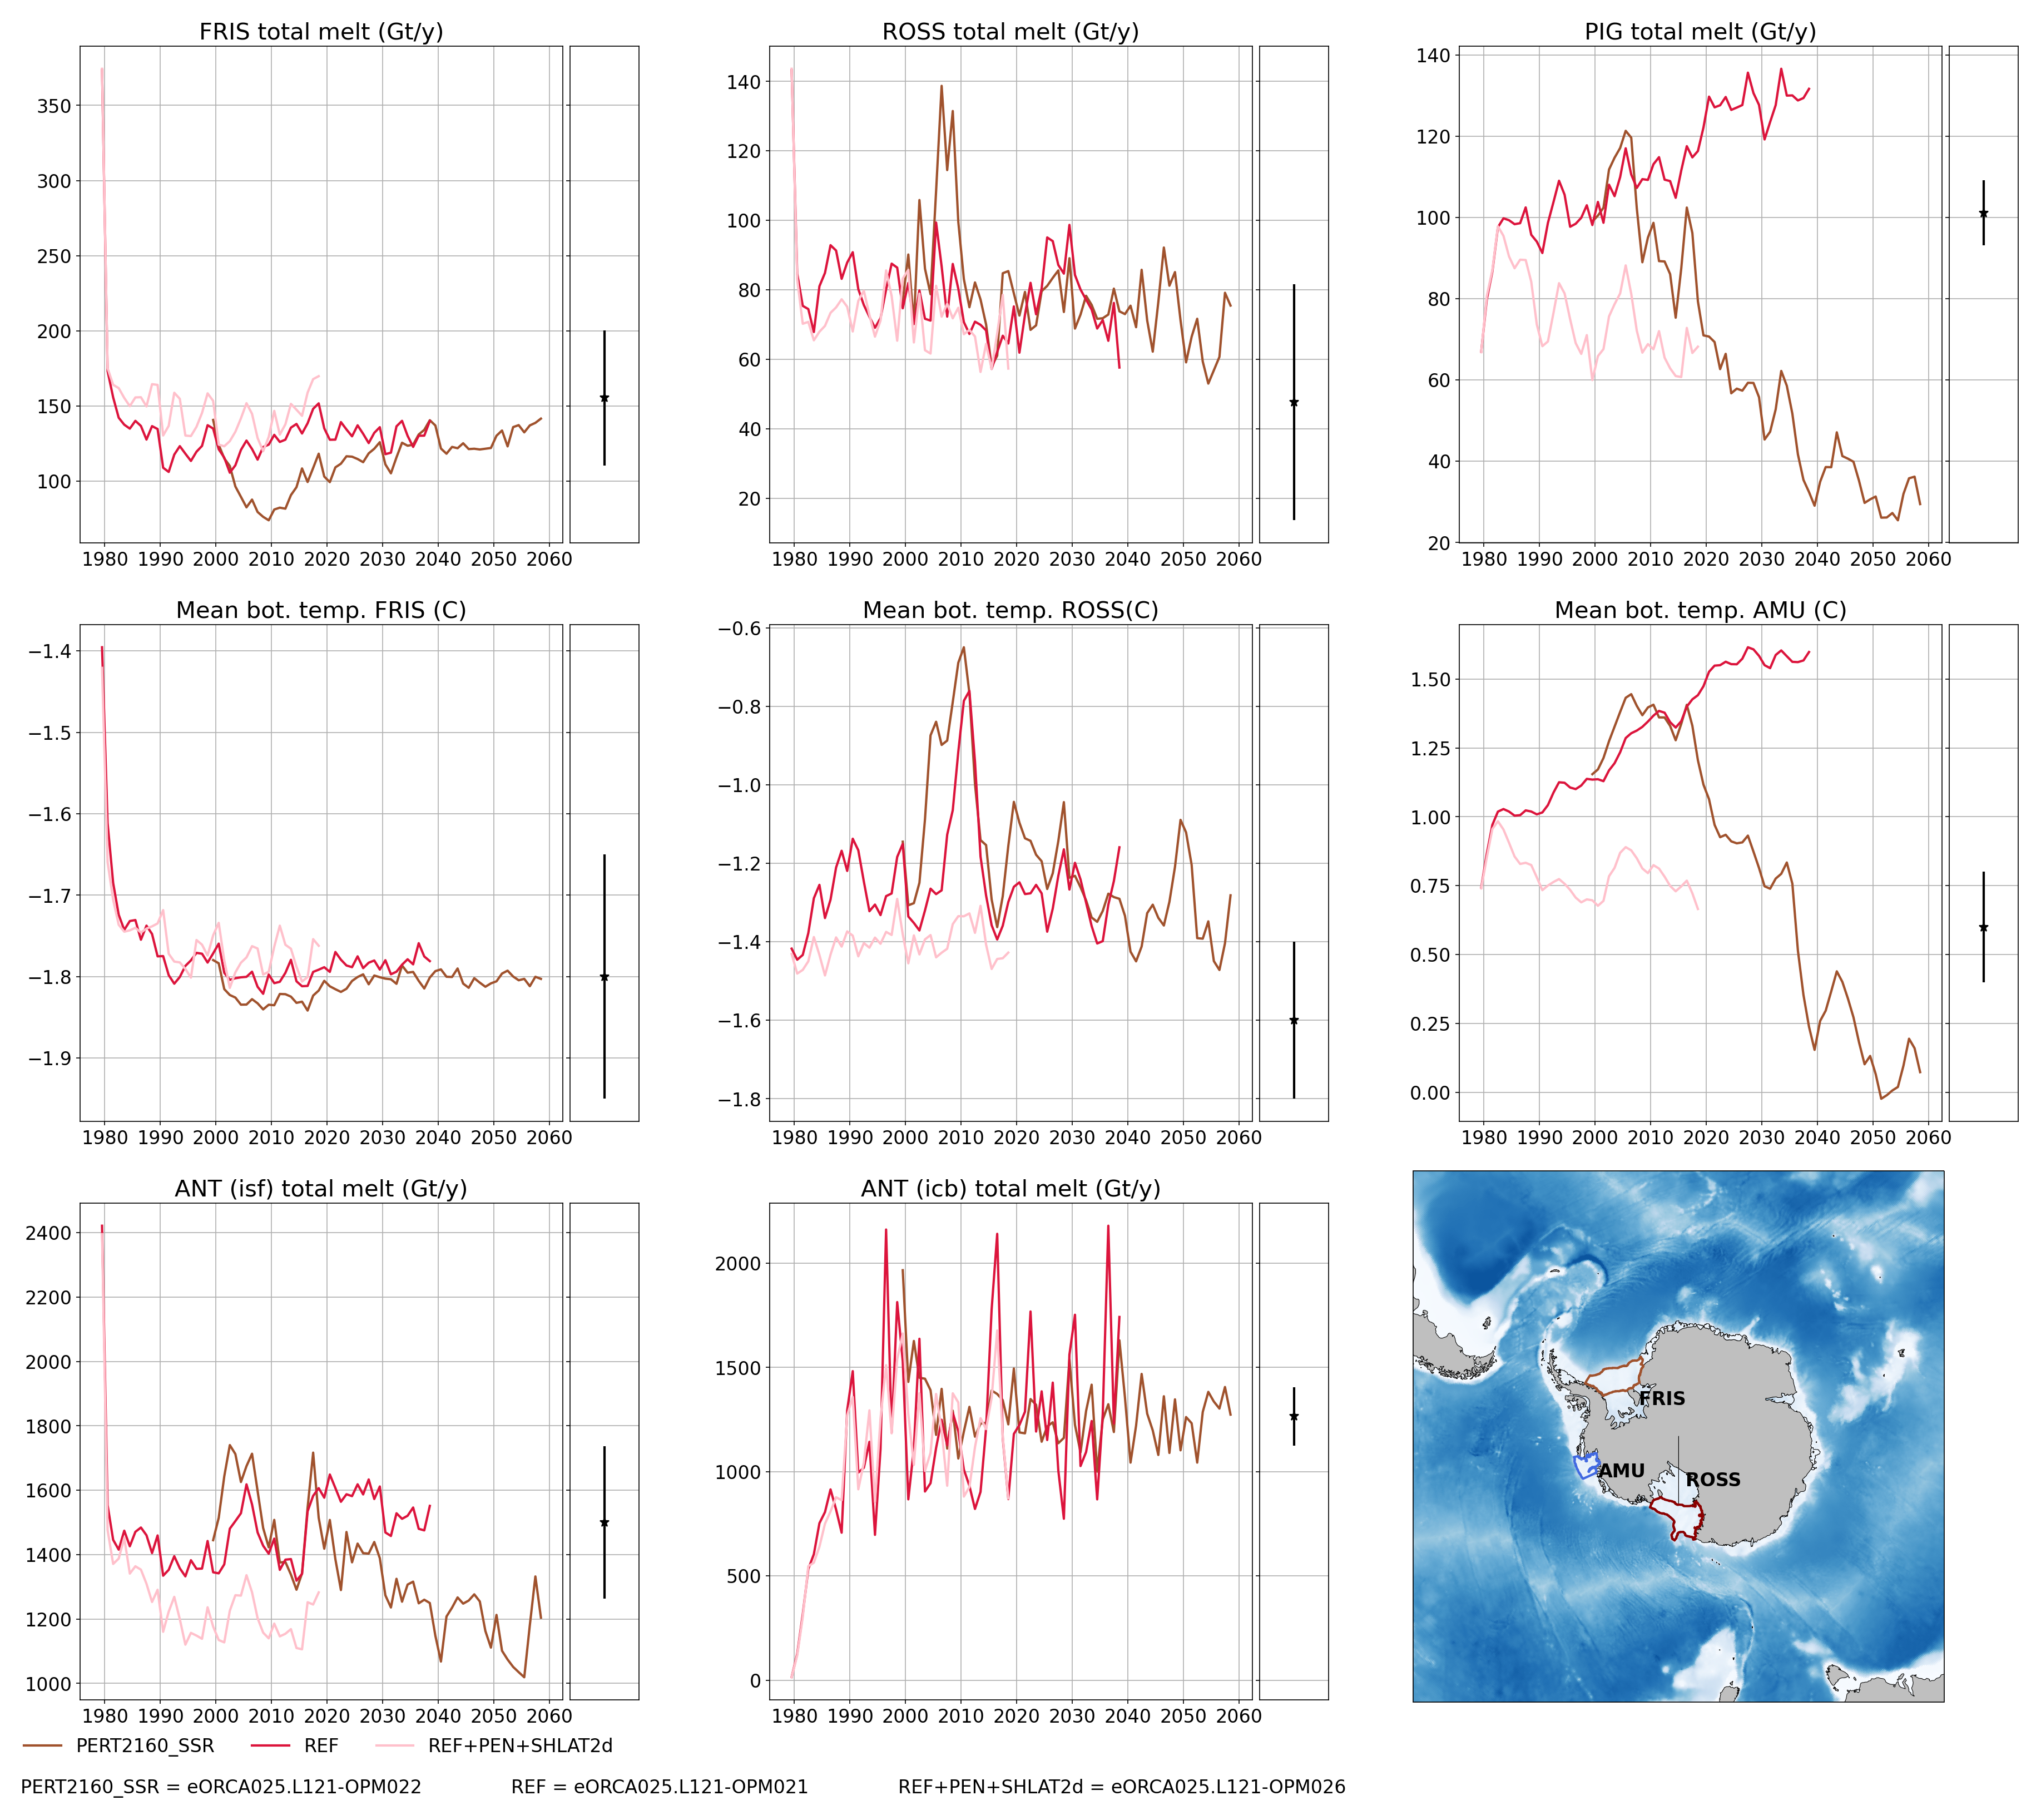
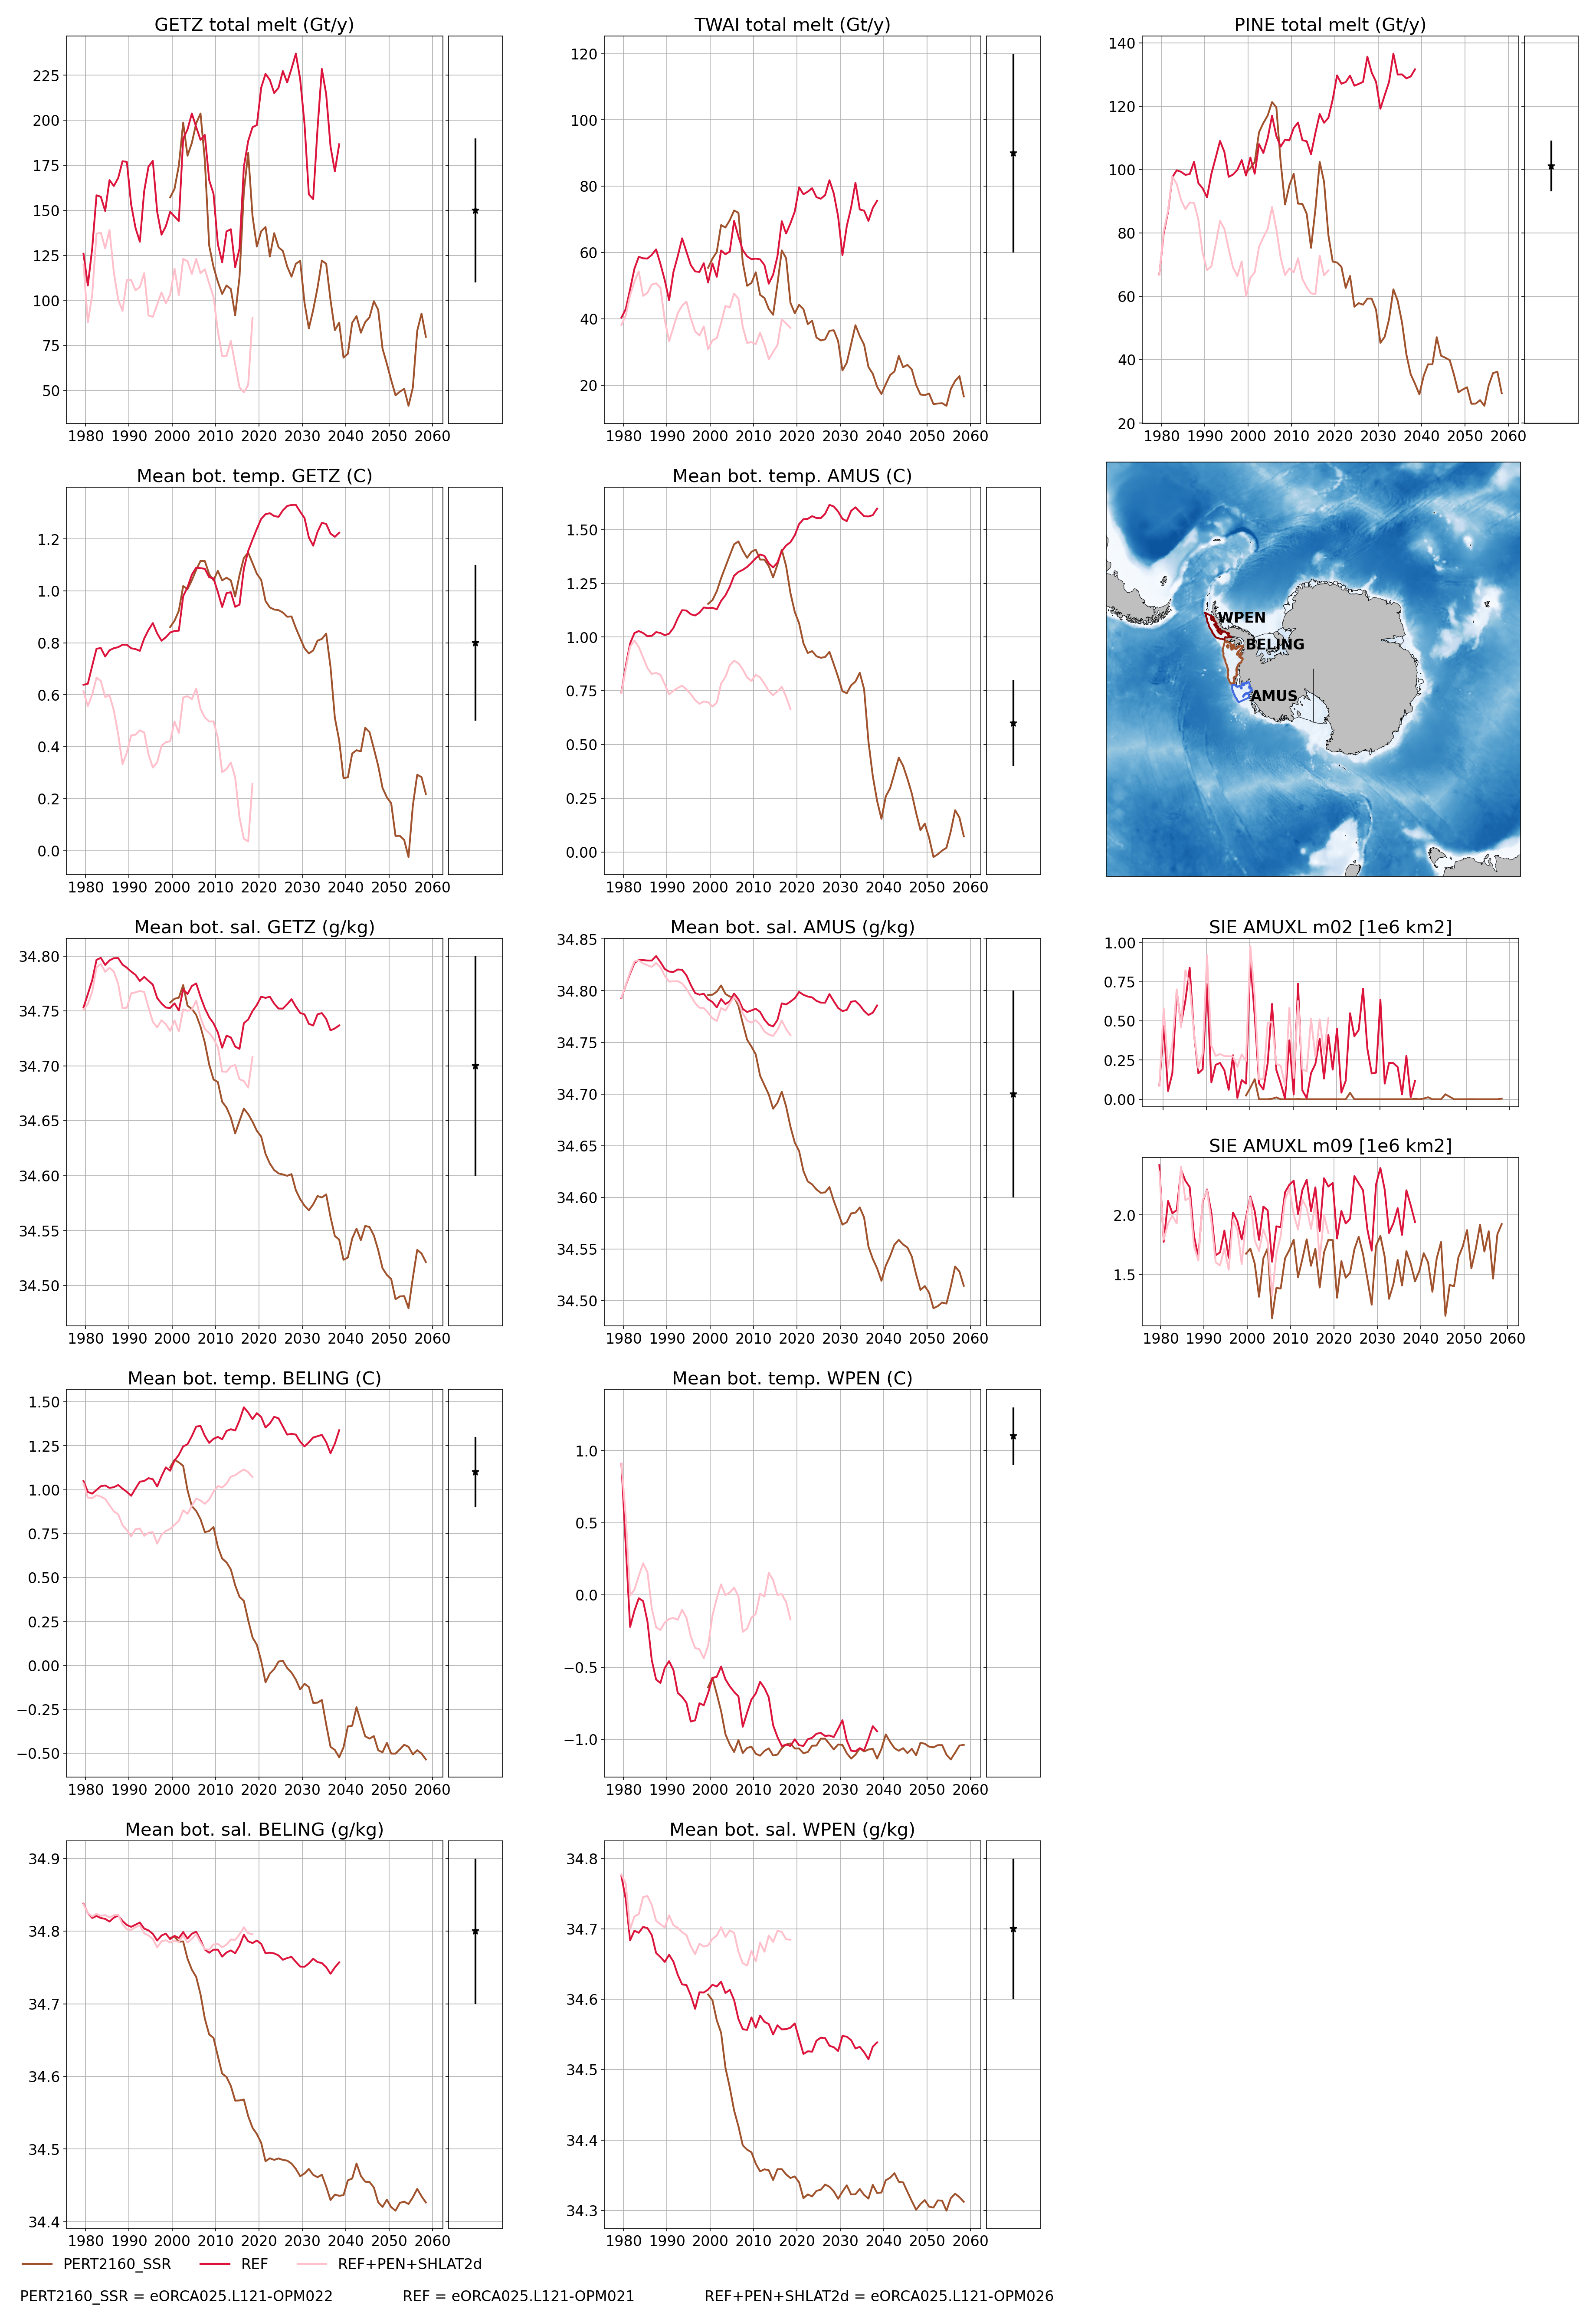
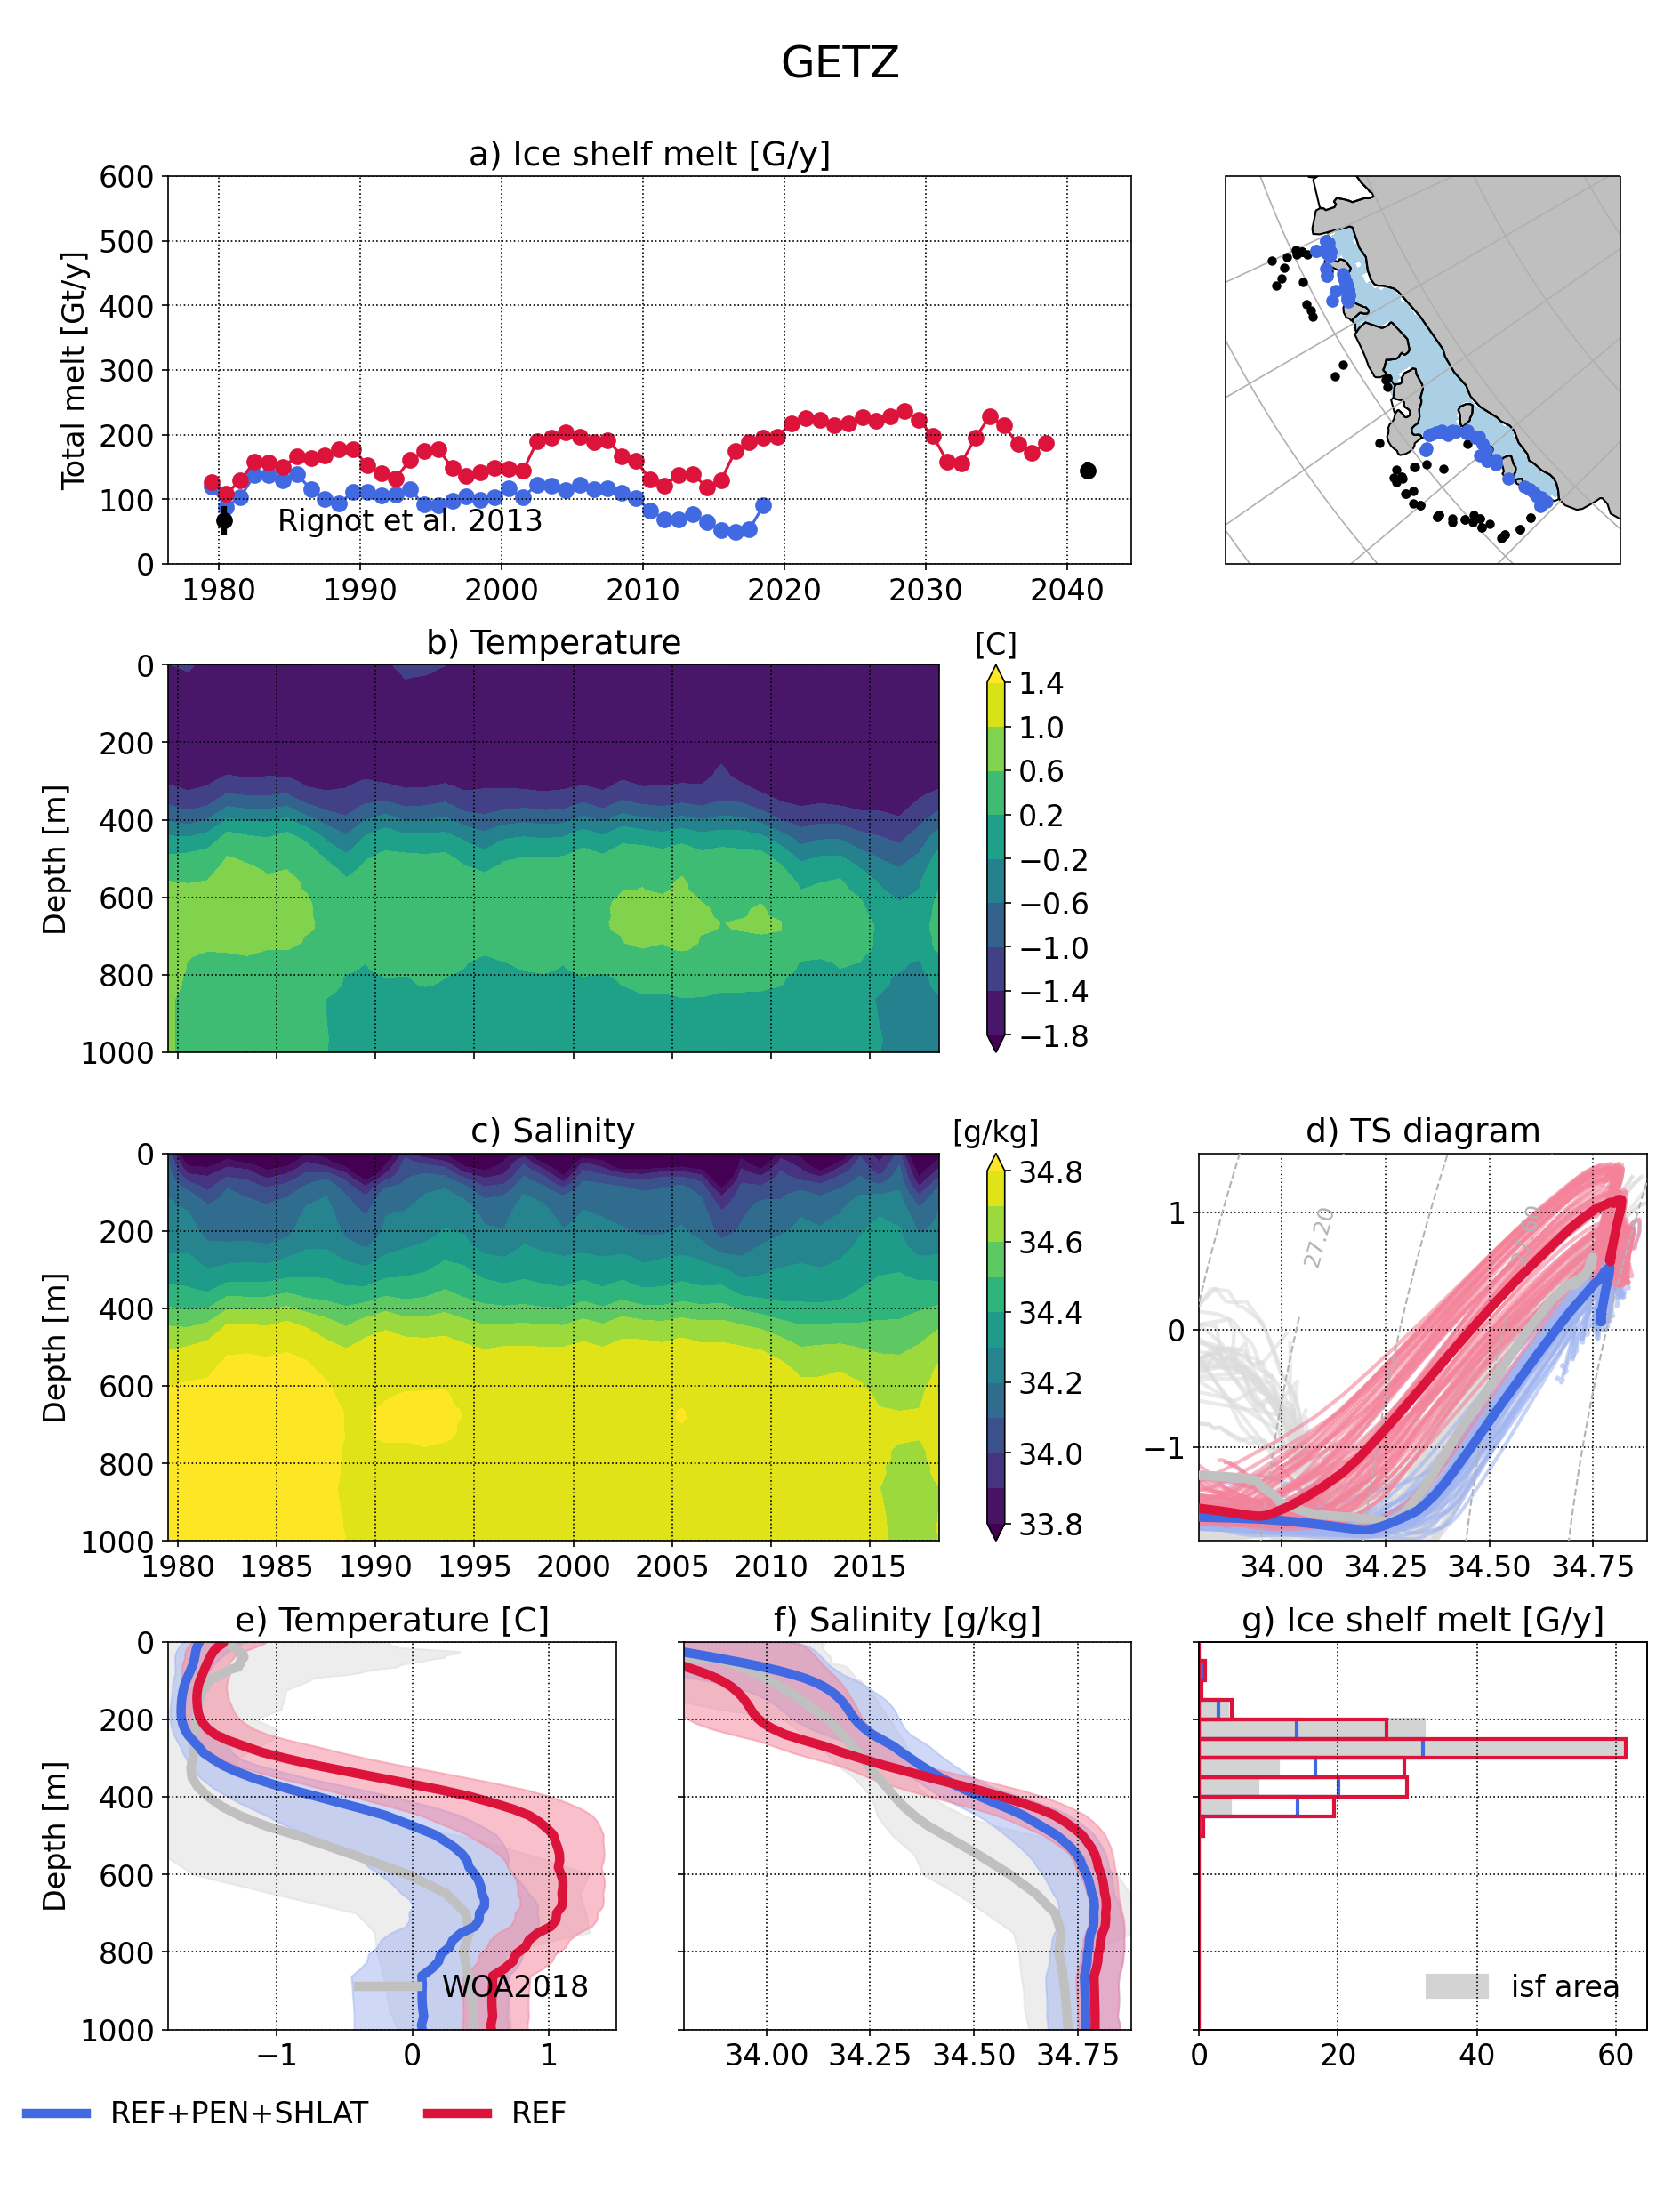
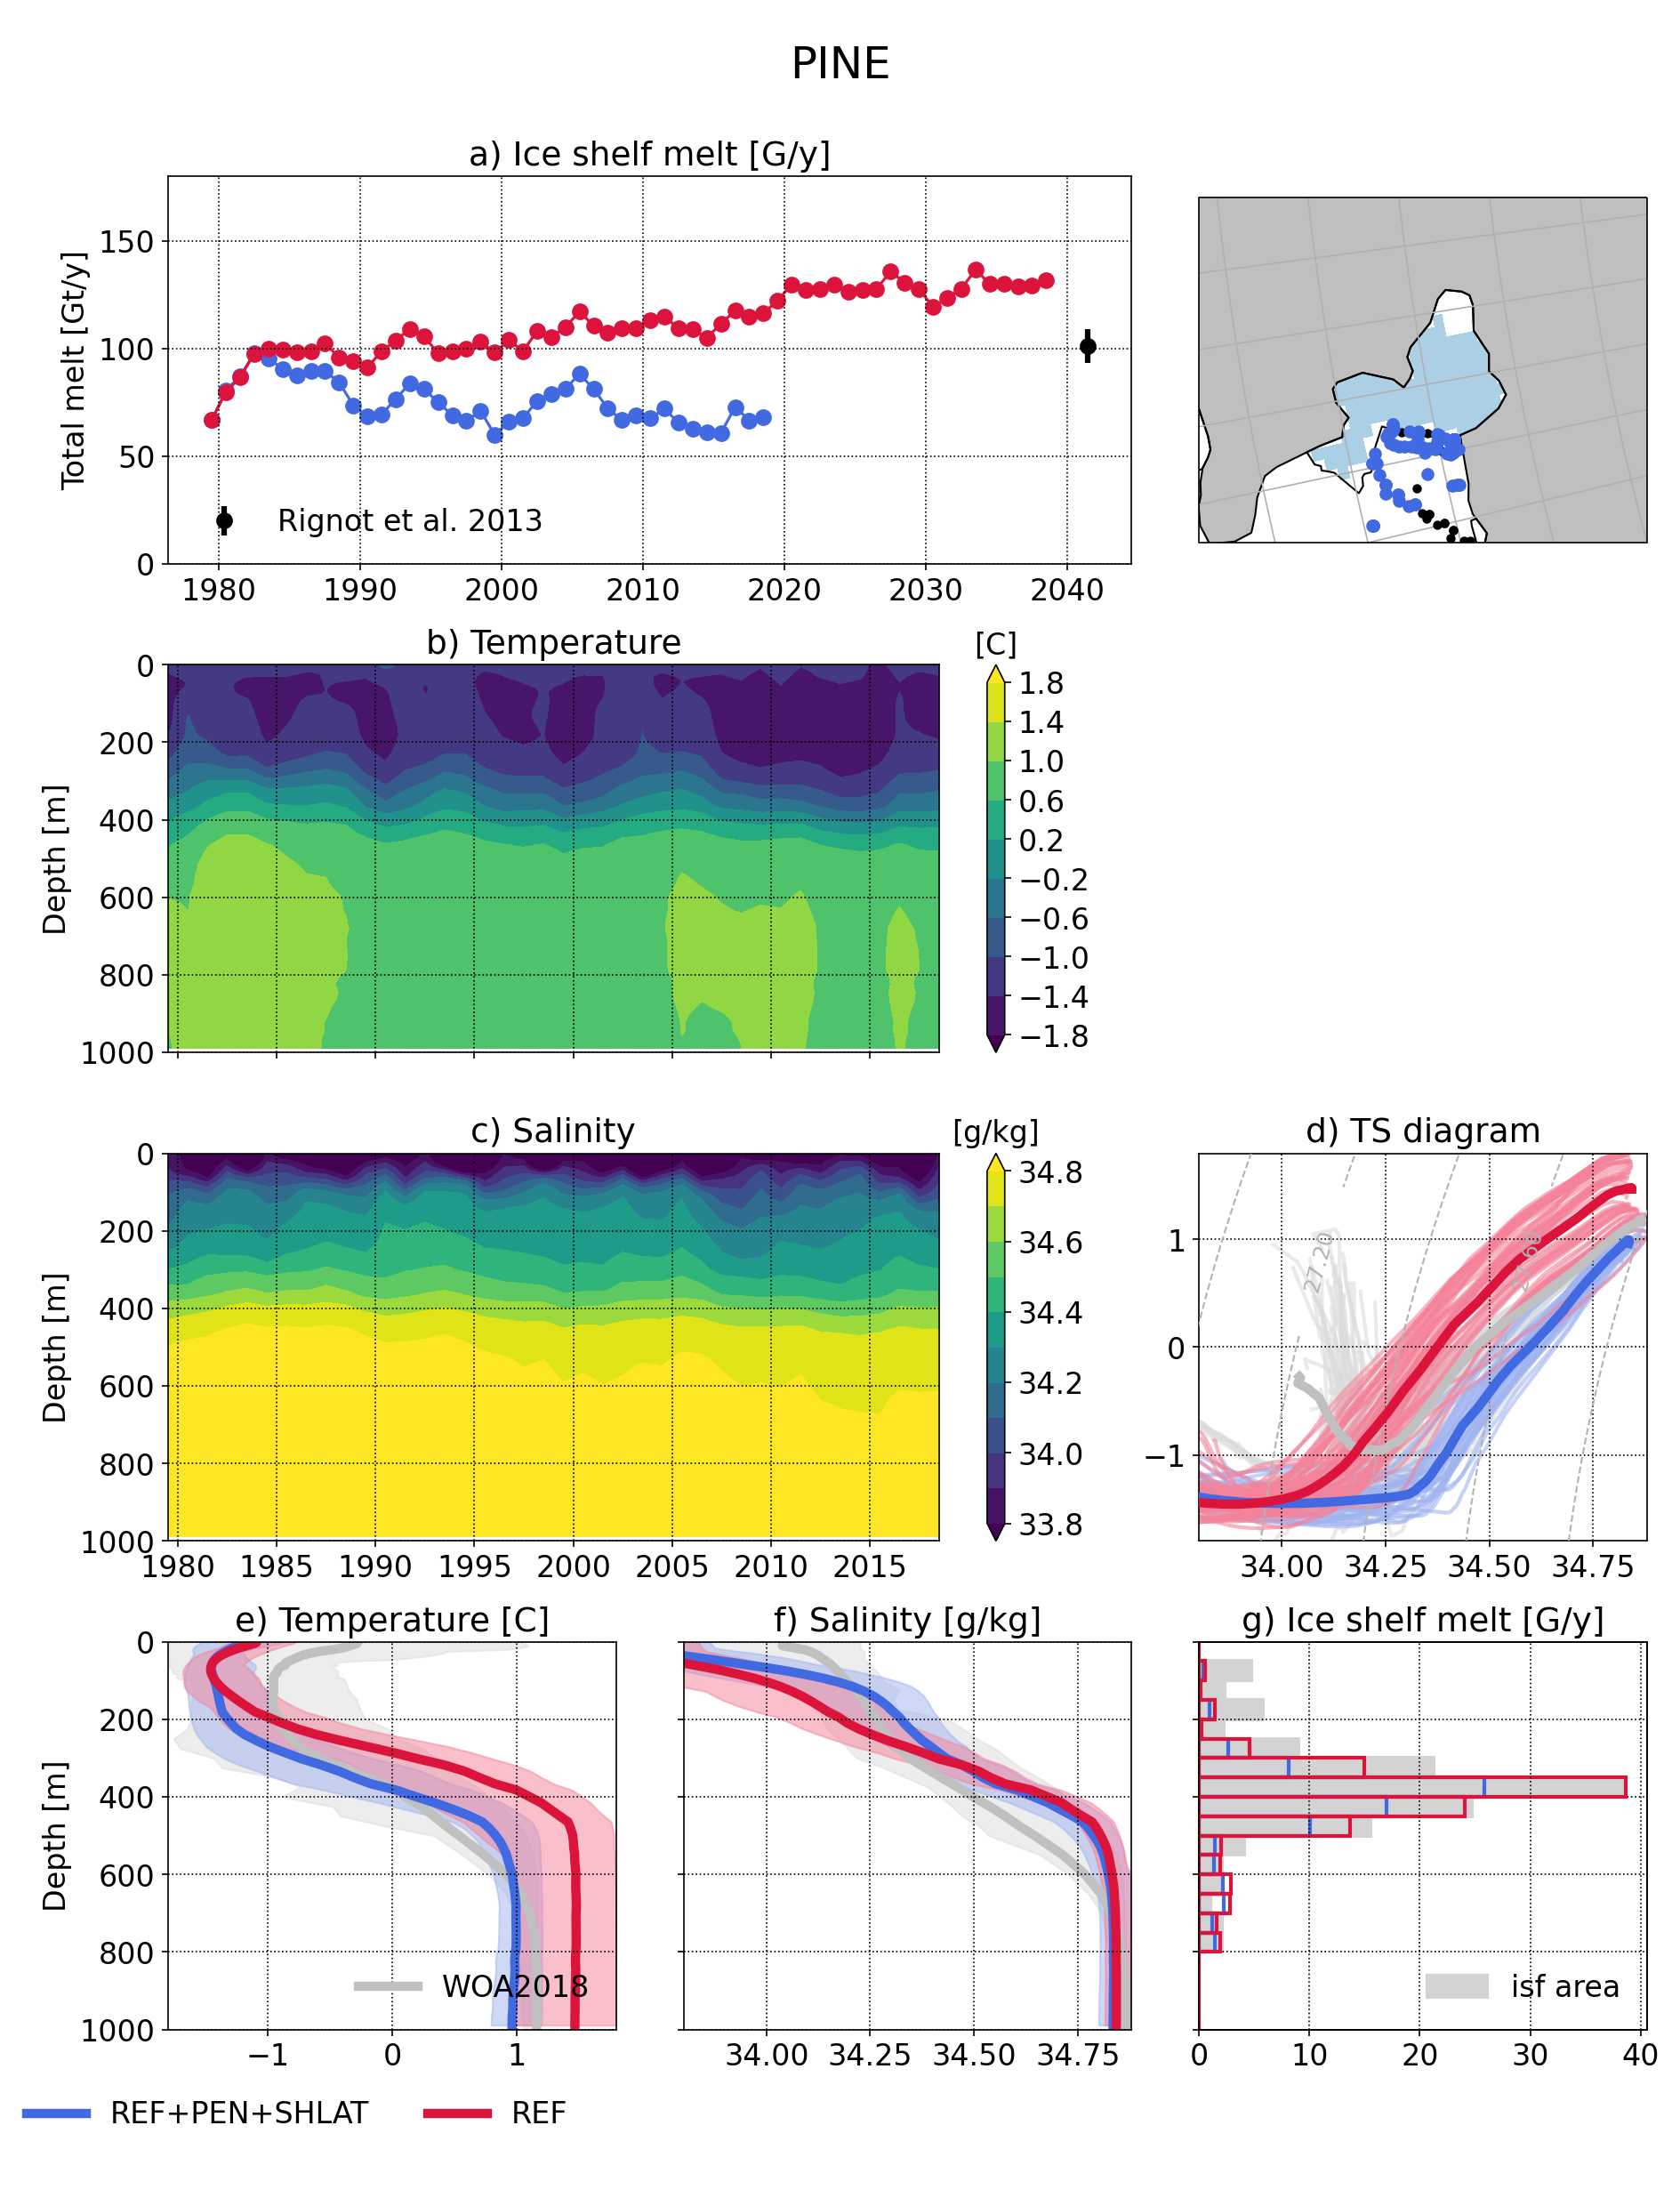
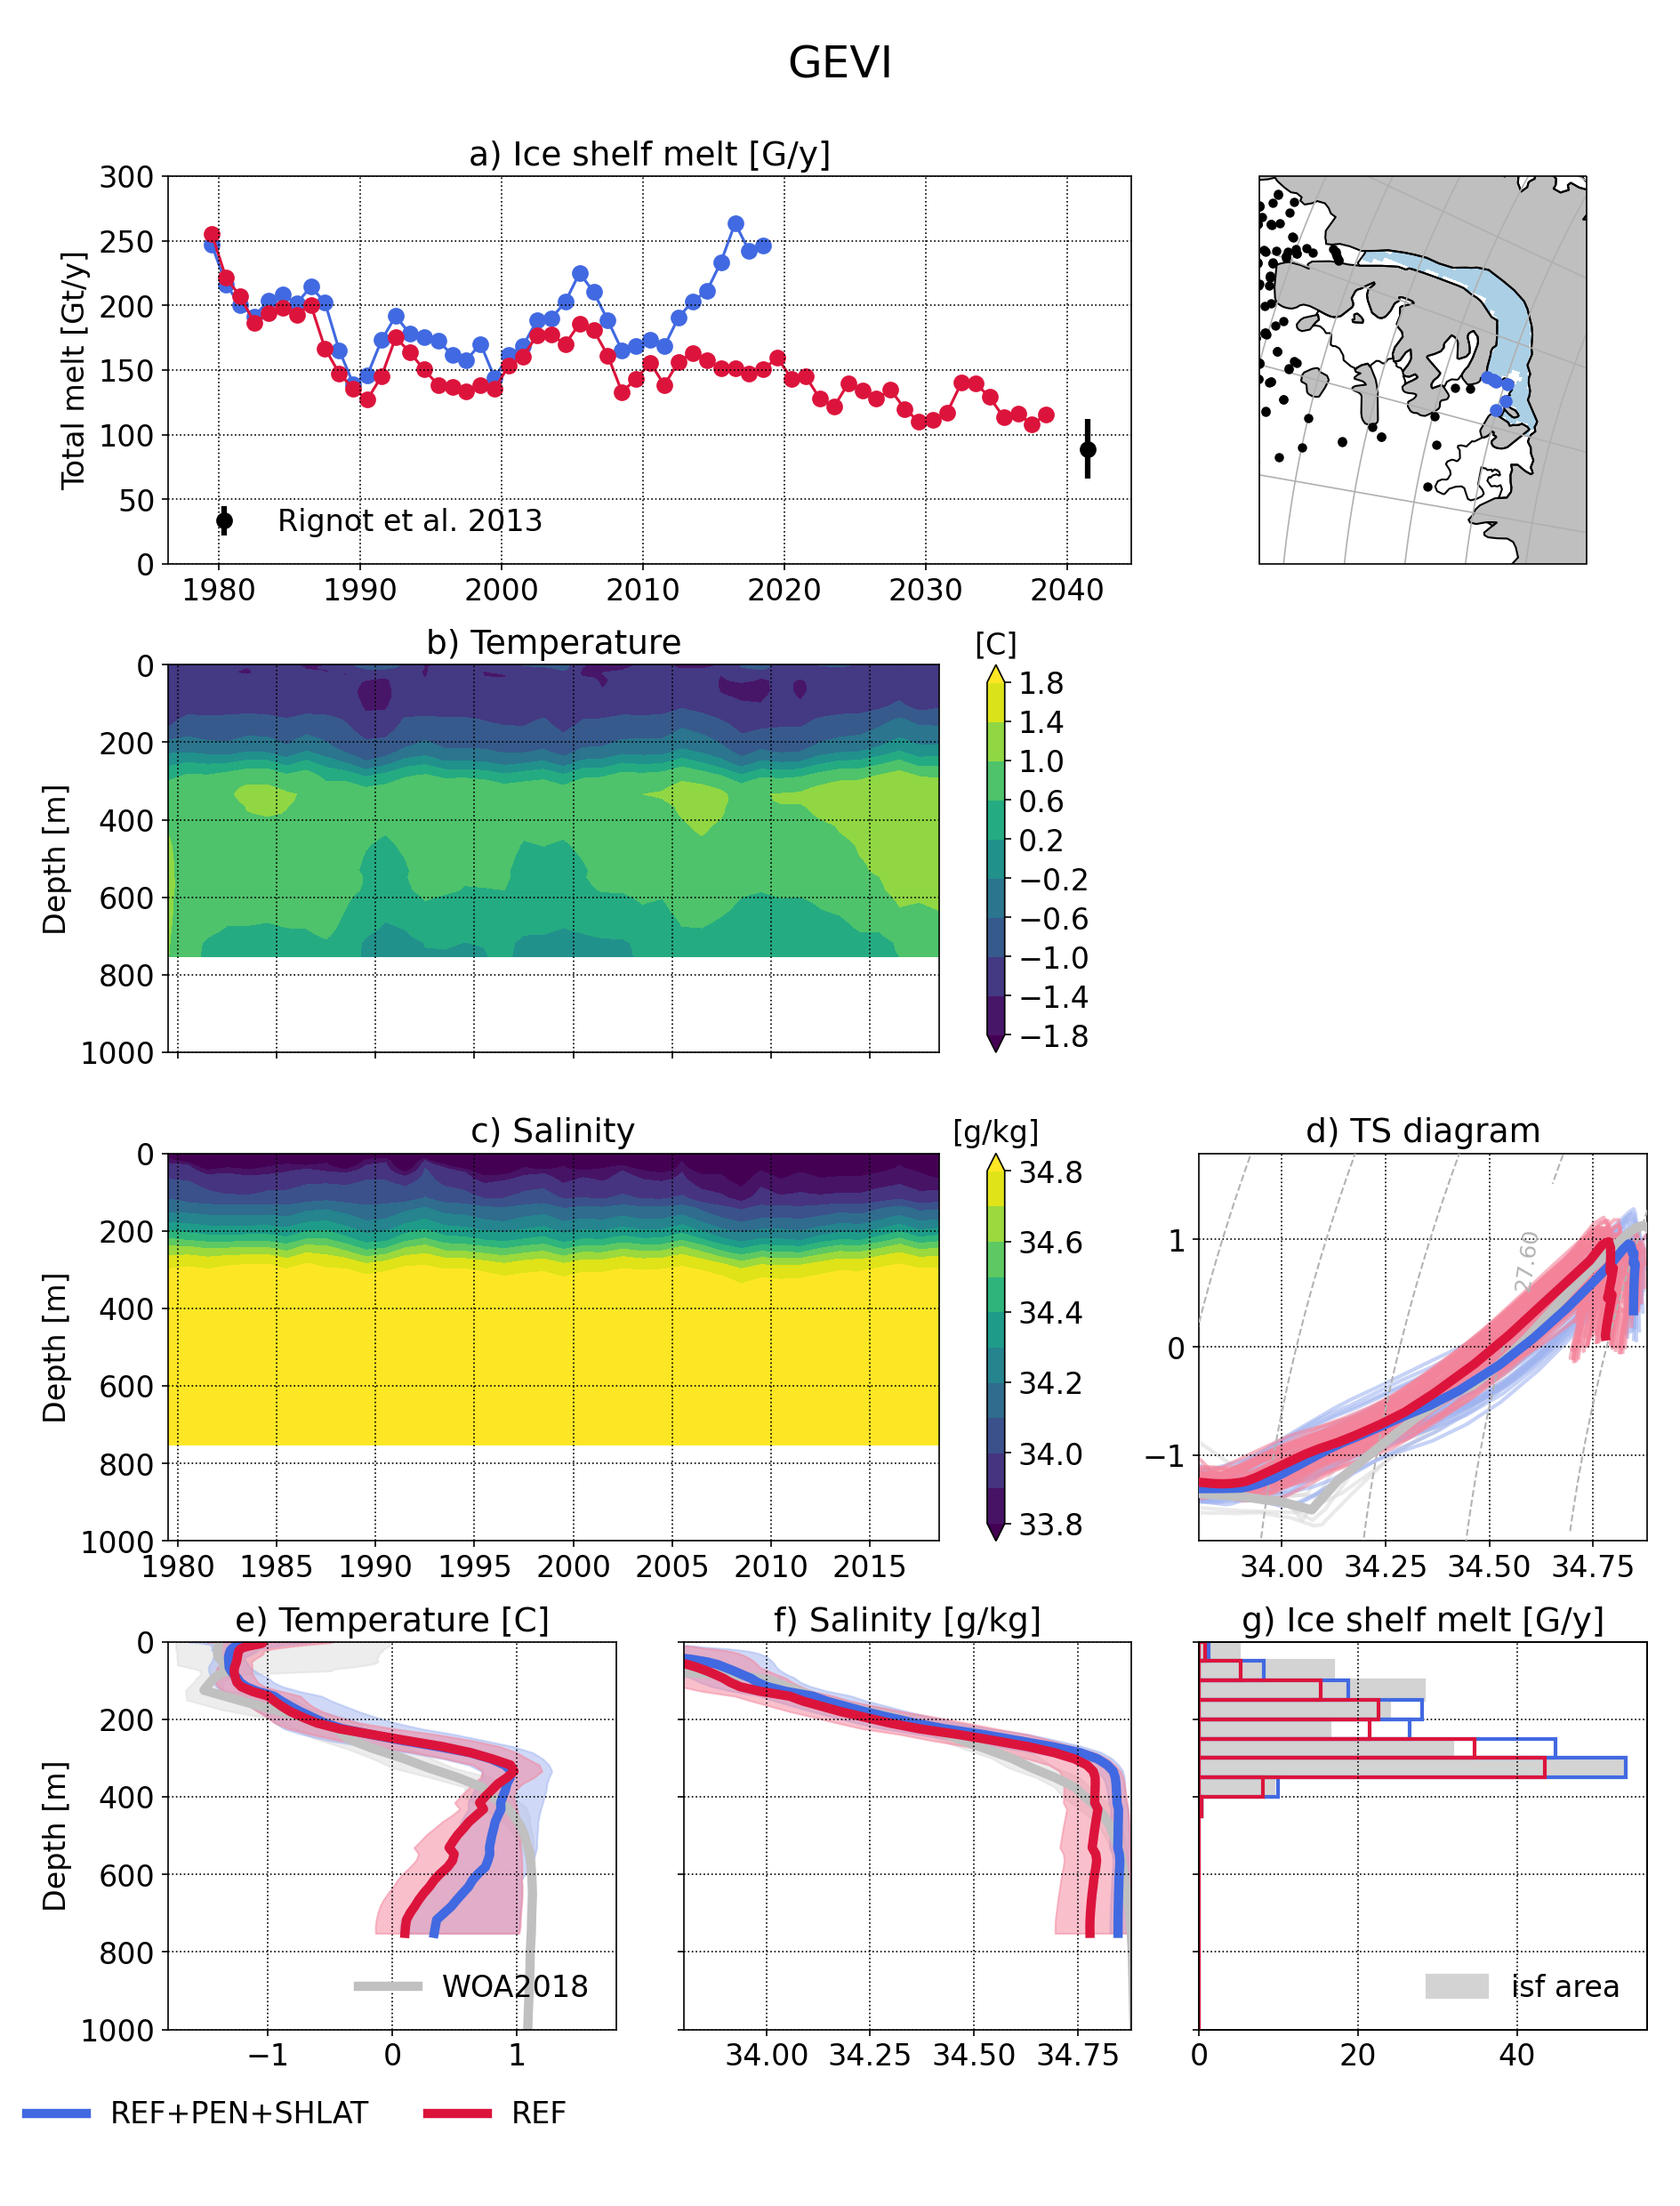
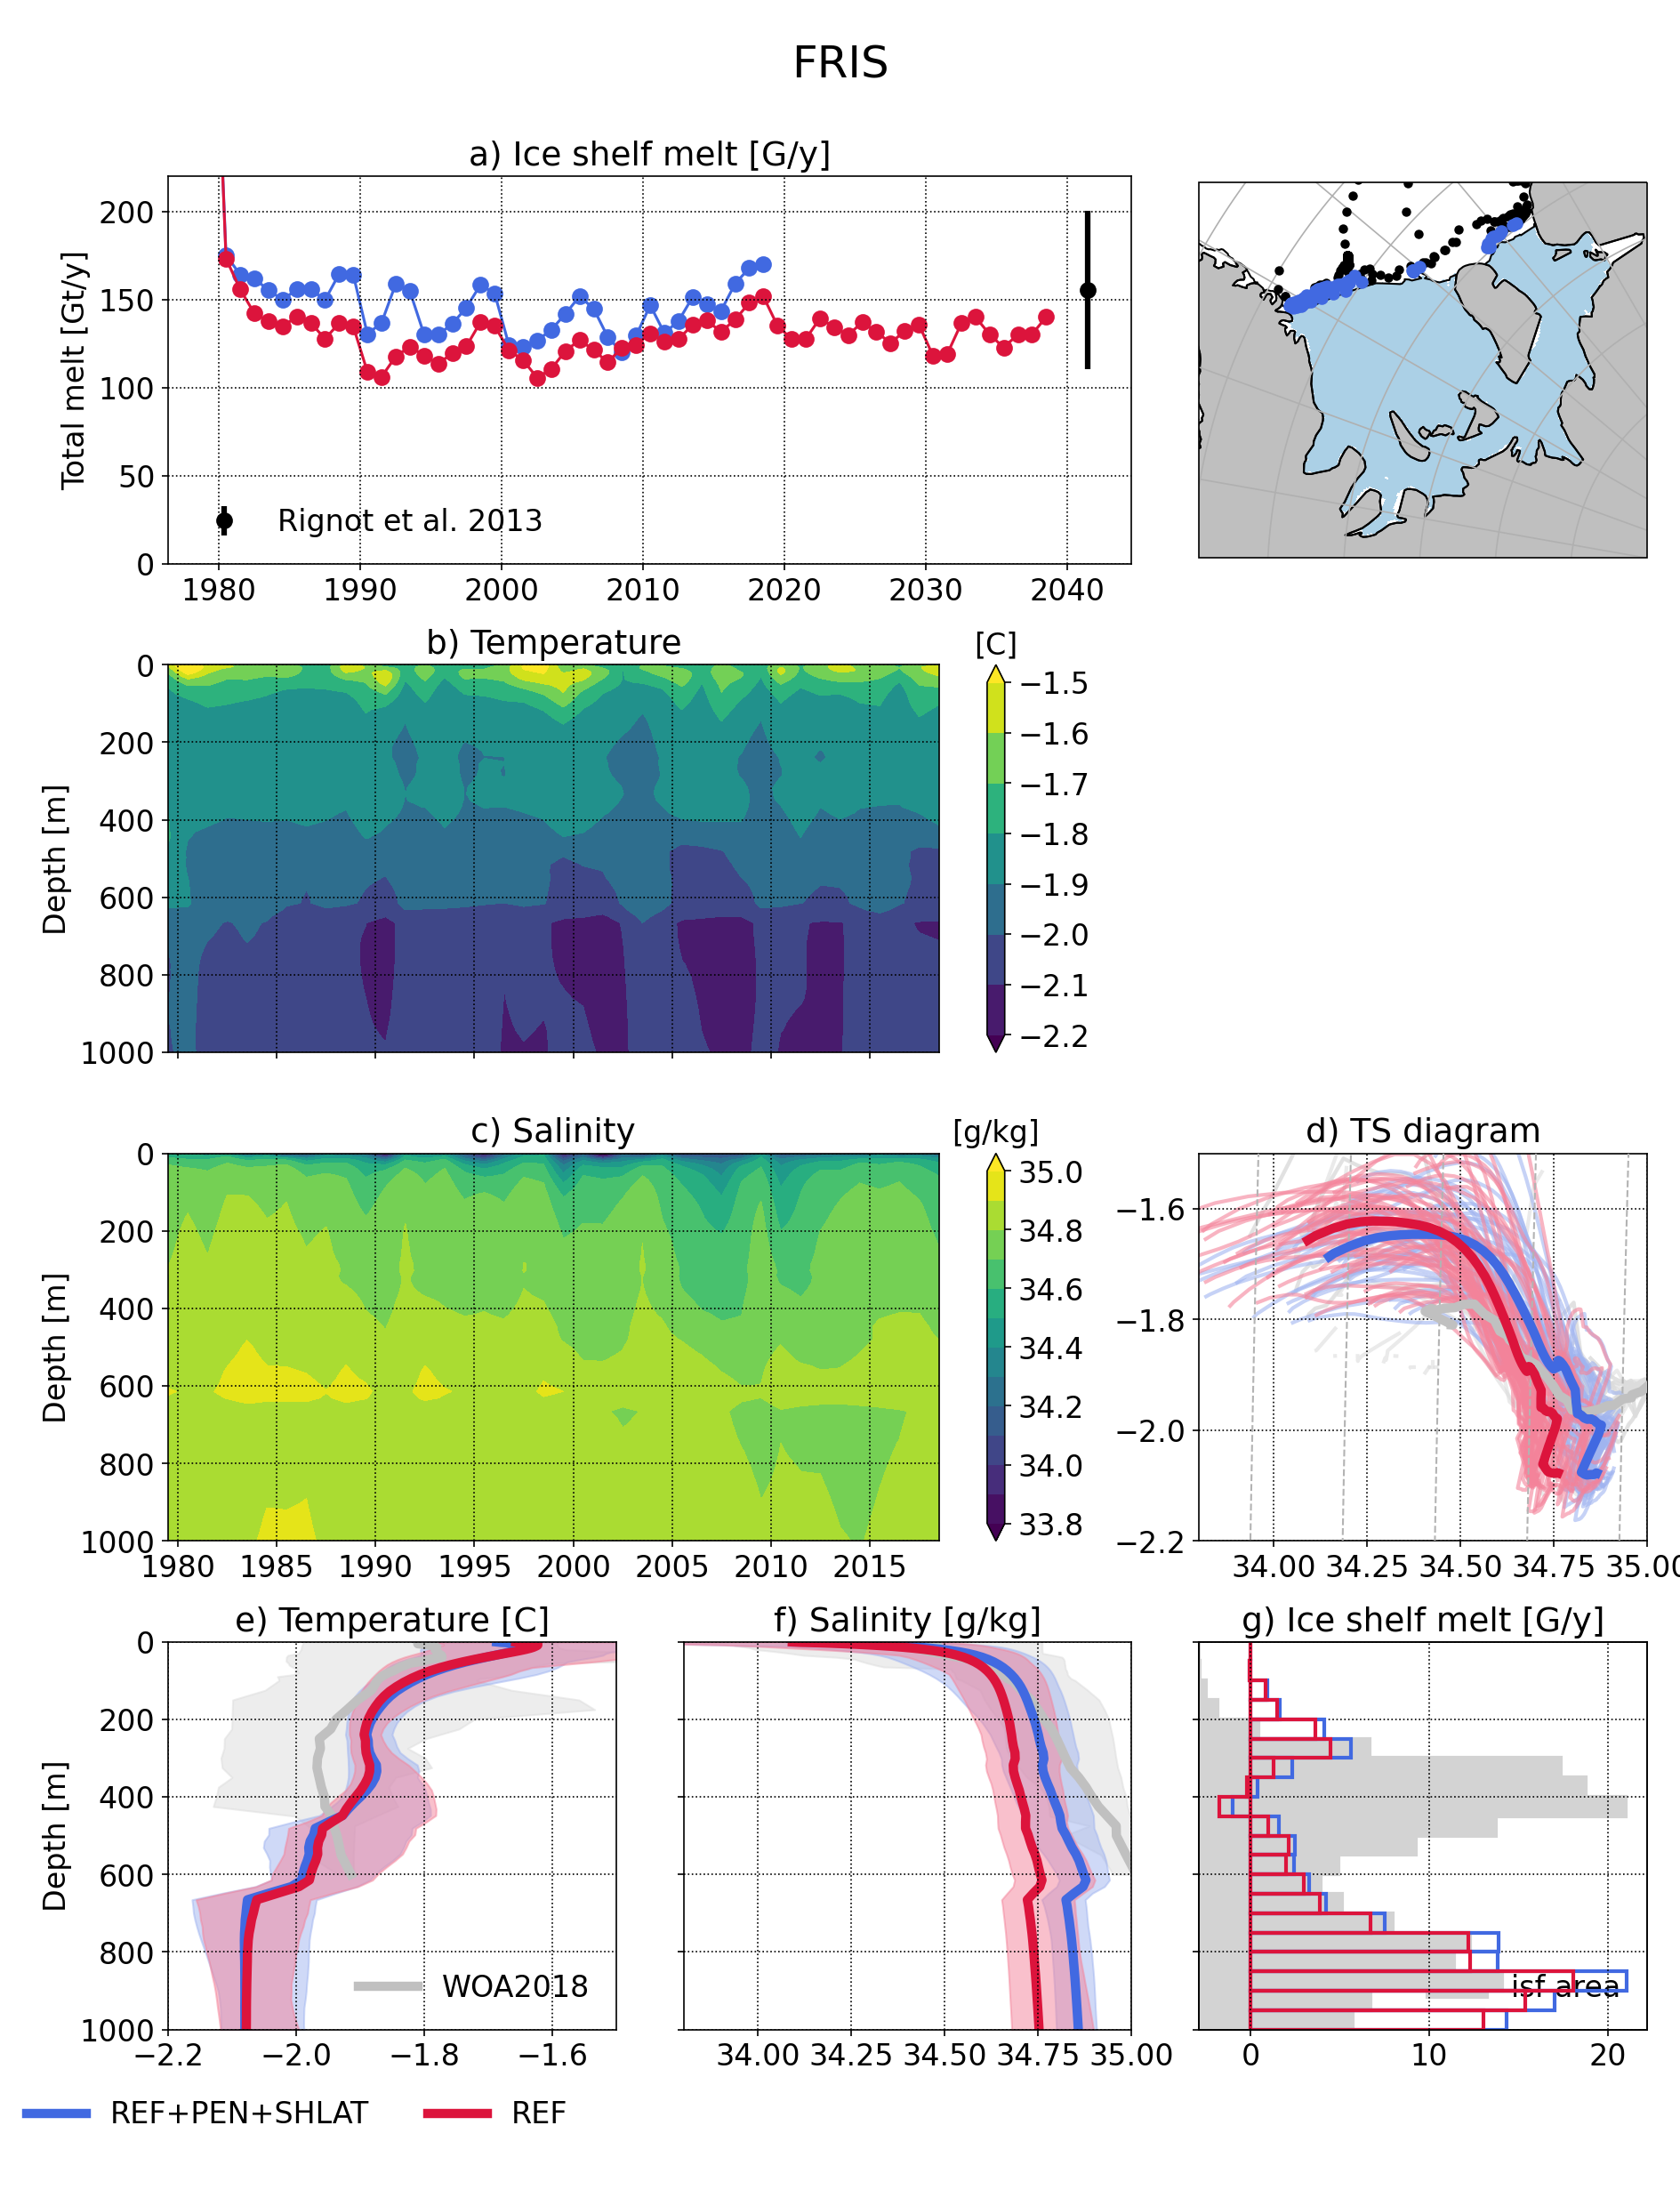
Local indicators
These plots monitor the evolution of ice shelf melting and the corresponding shelf properties (ROSS, FRIS, PINE, GETZ)
Amundsen/Belingshausen seas
These plot monitoring the evolution of temperature, salinity and ice shelf melt in Amundsen sea.
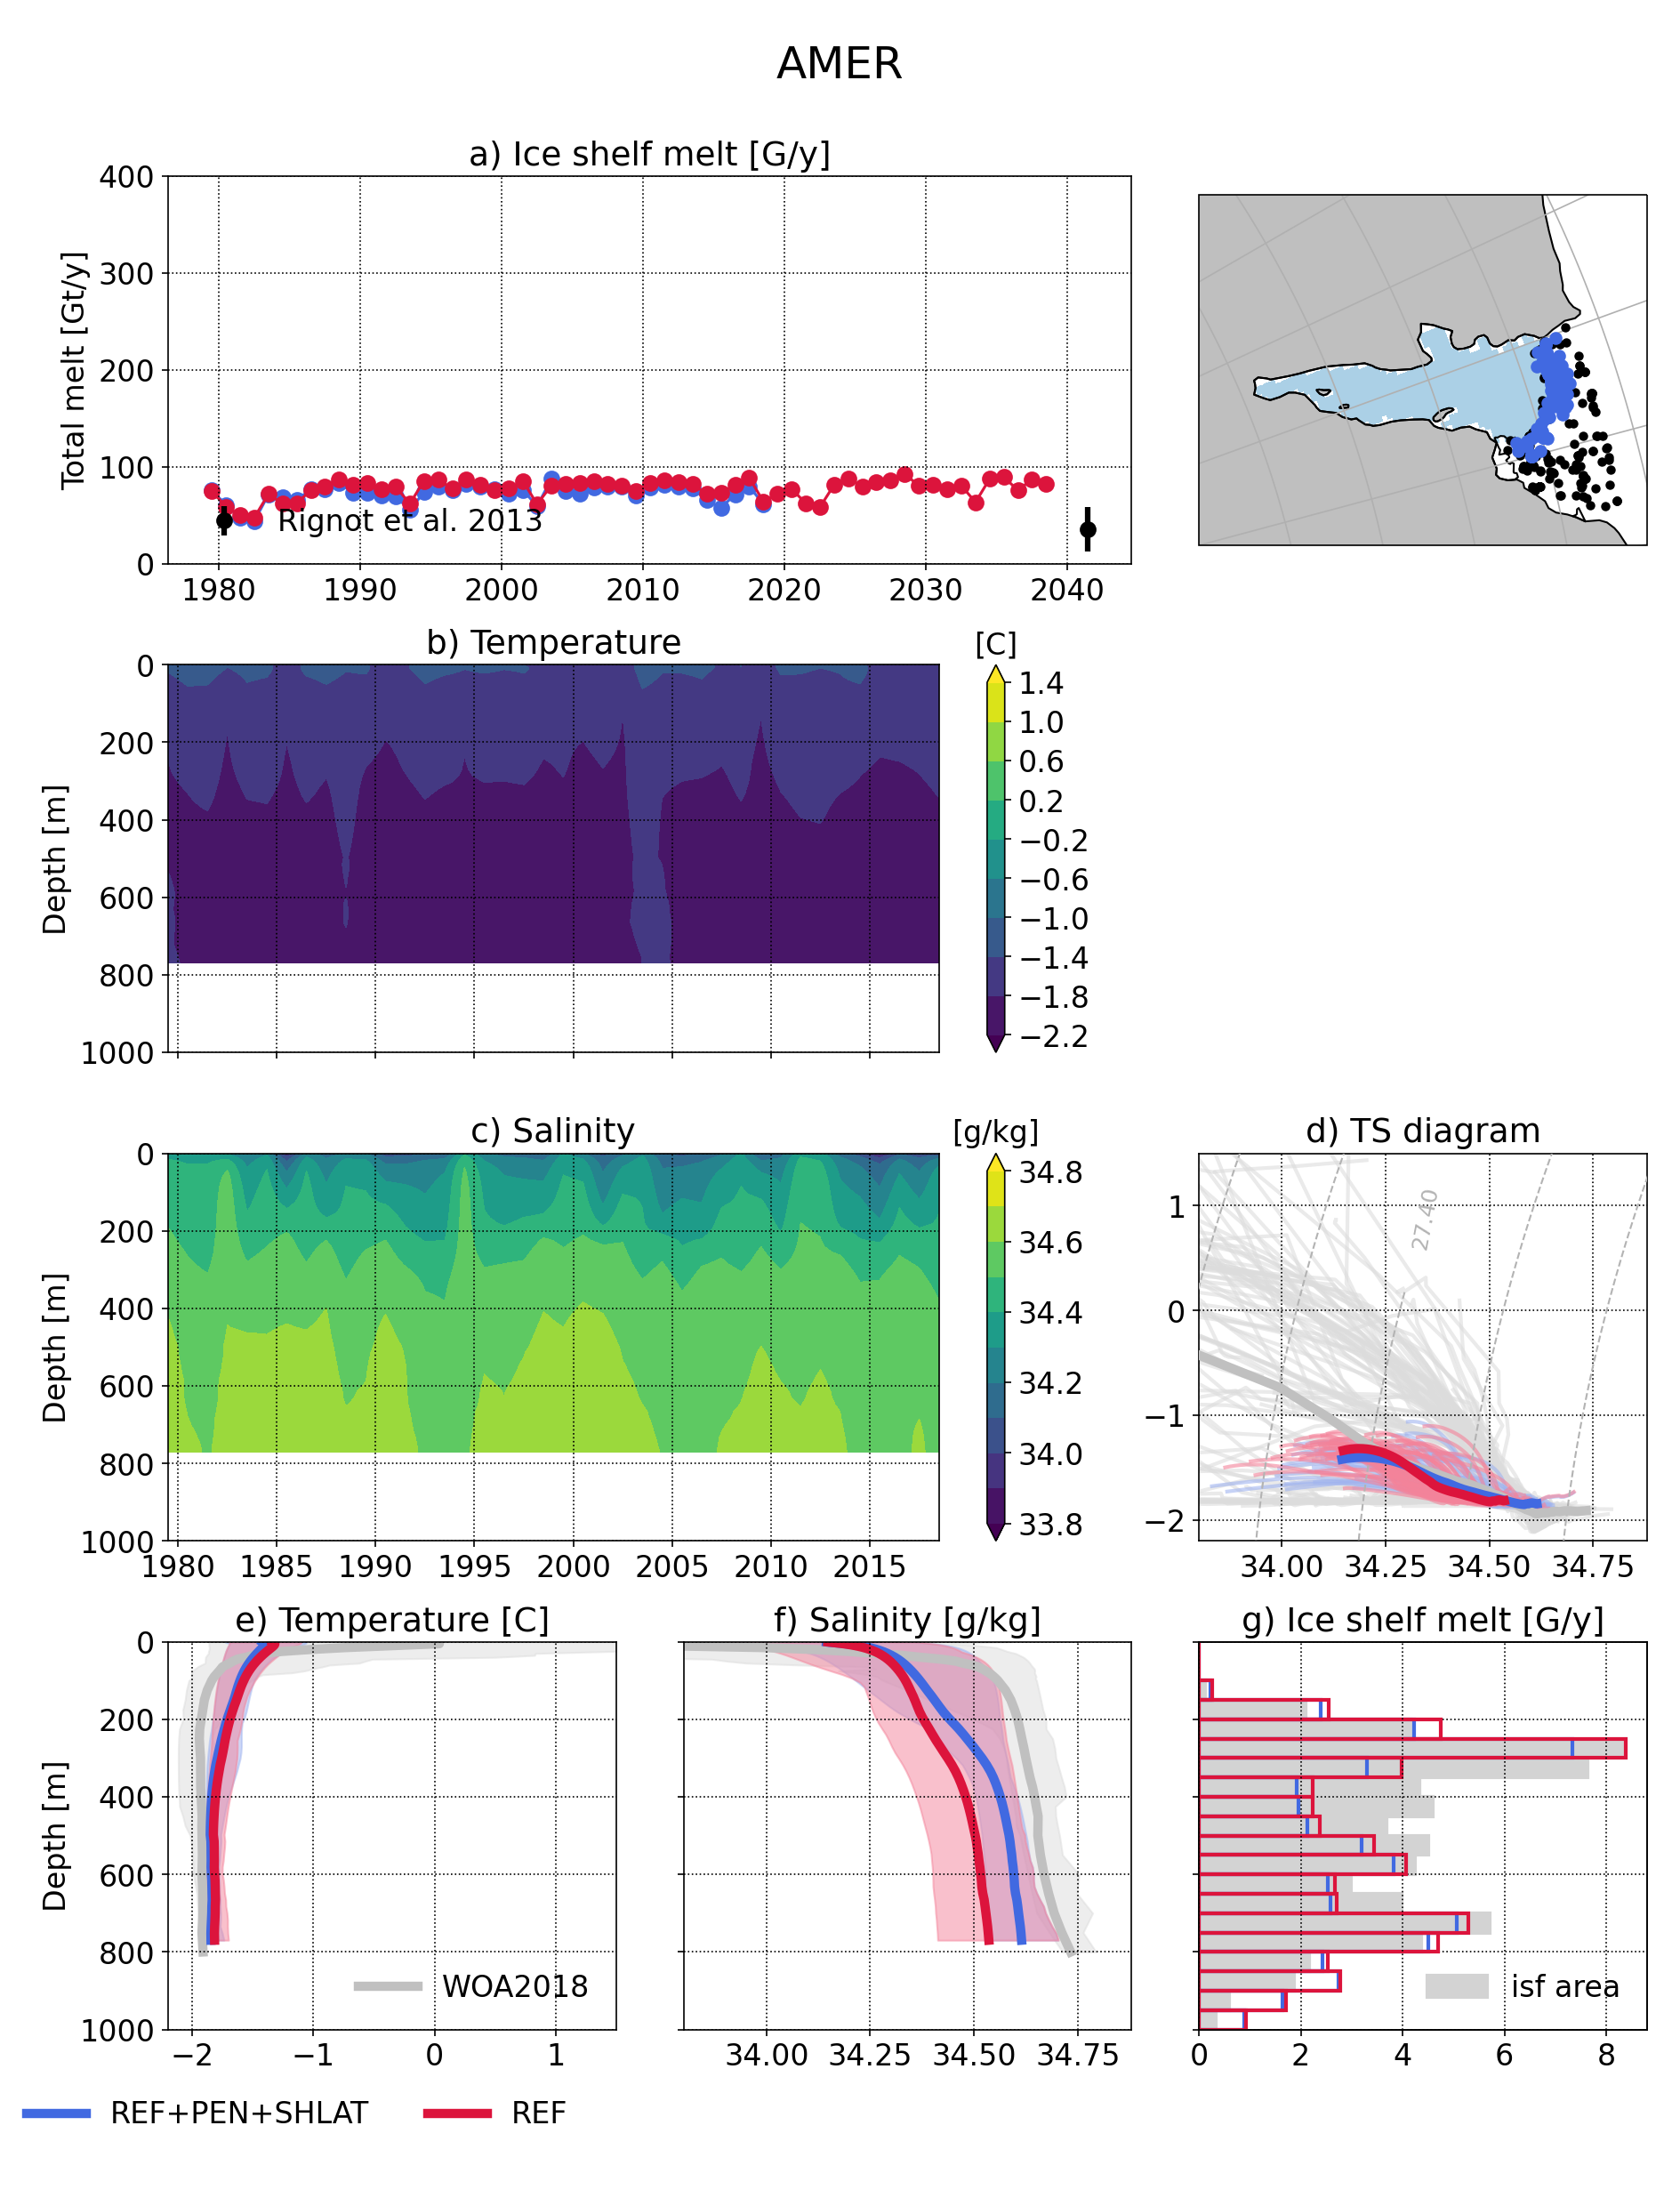
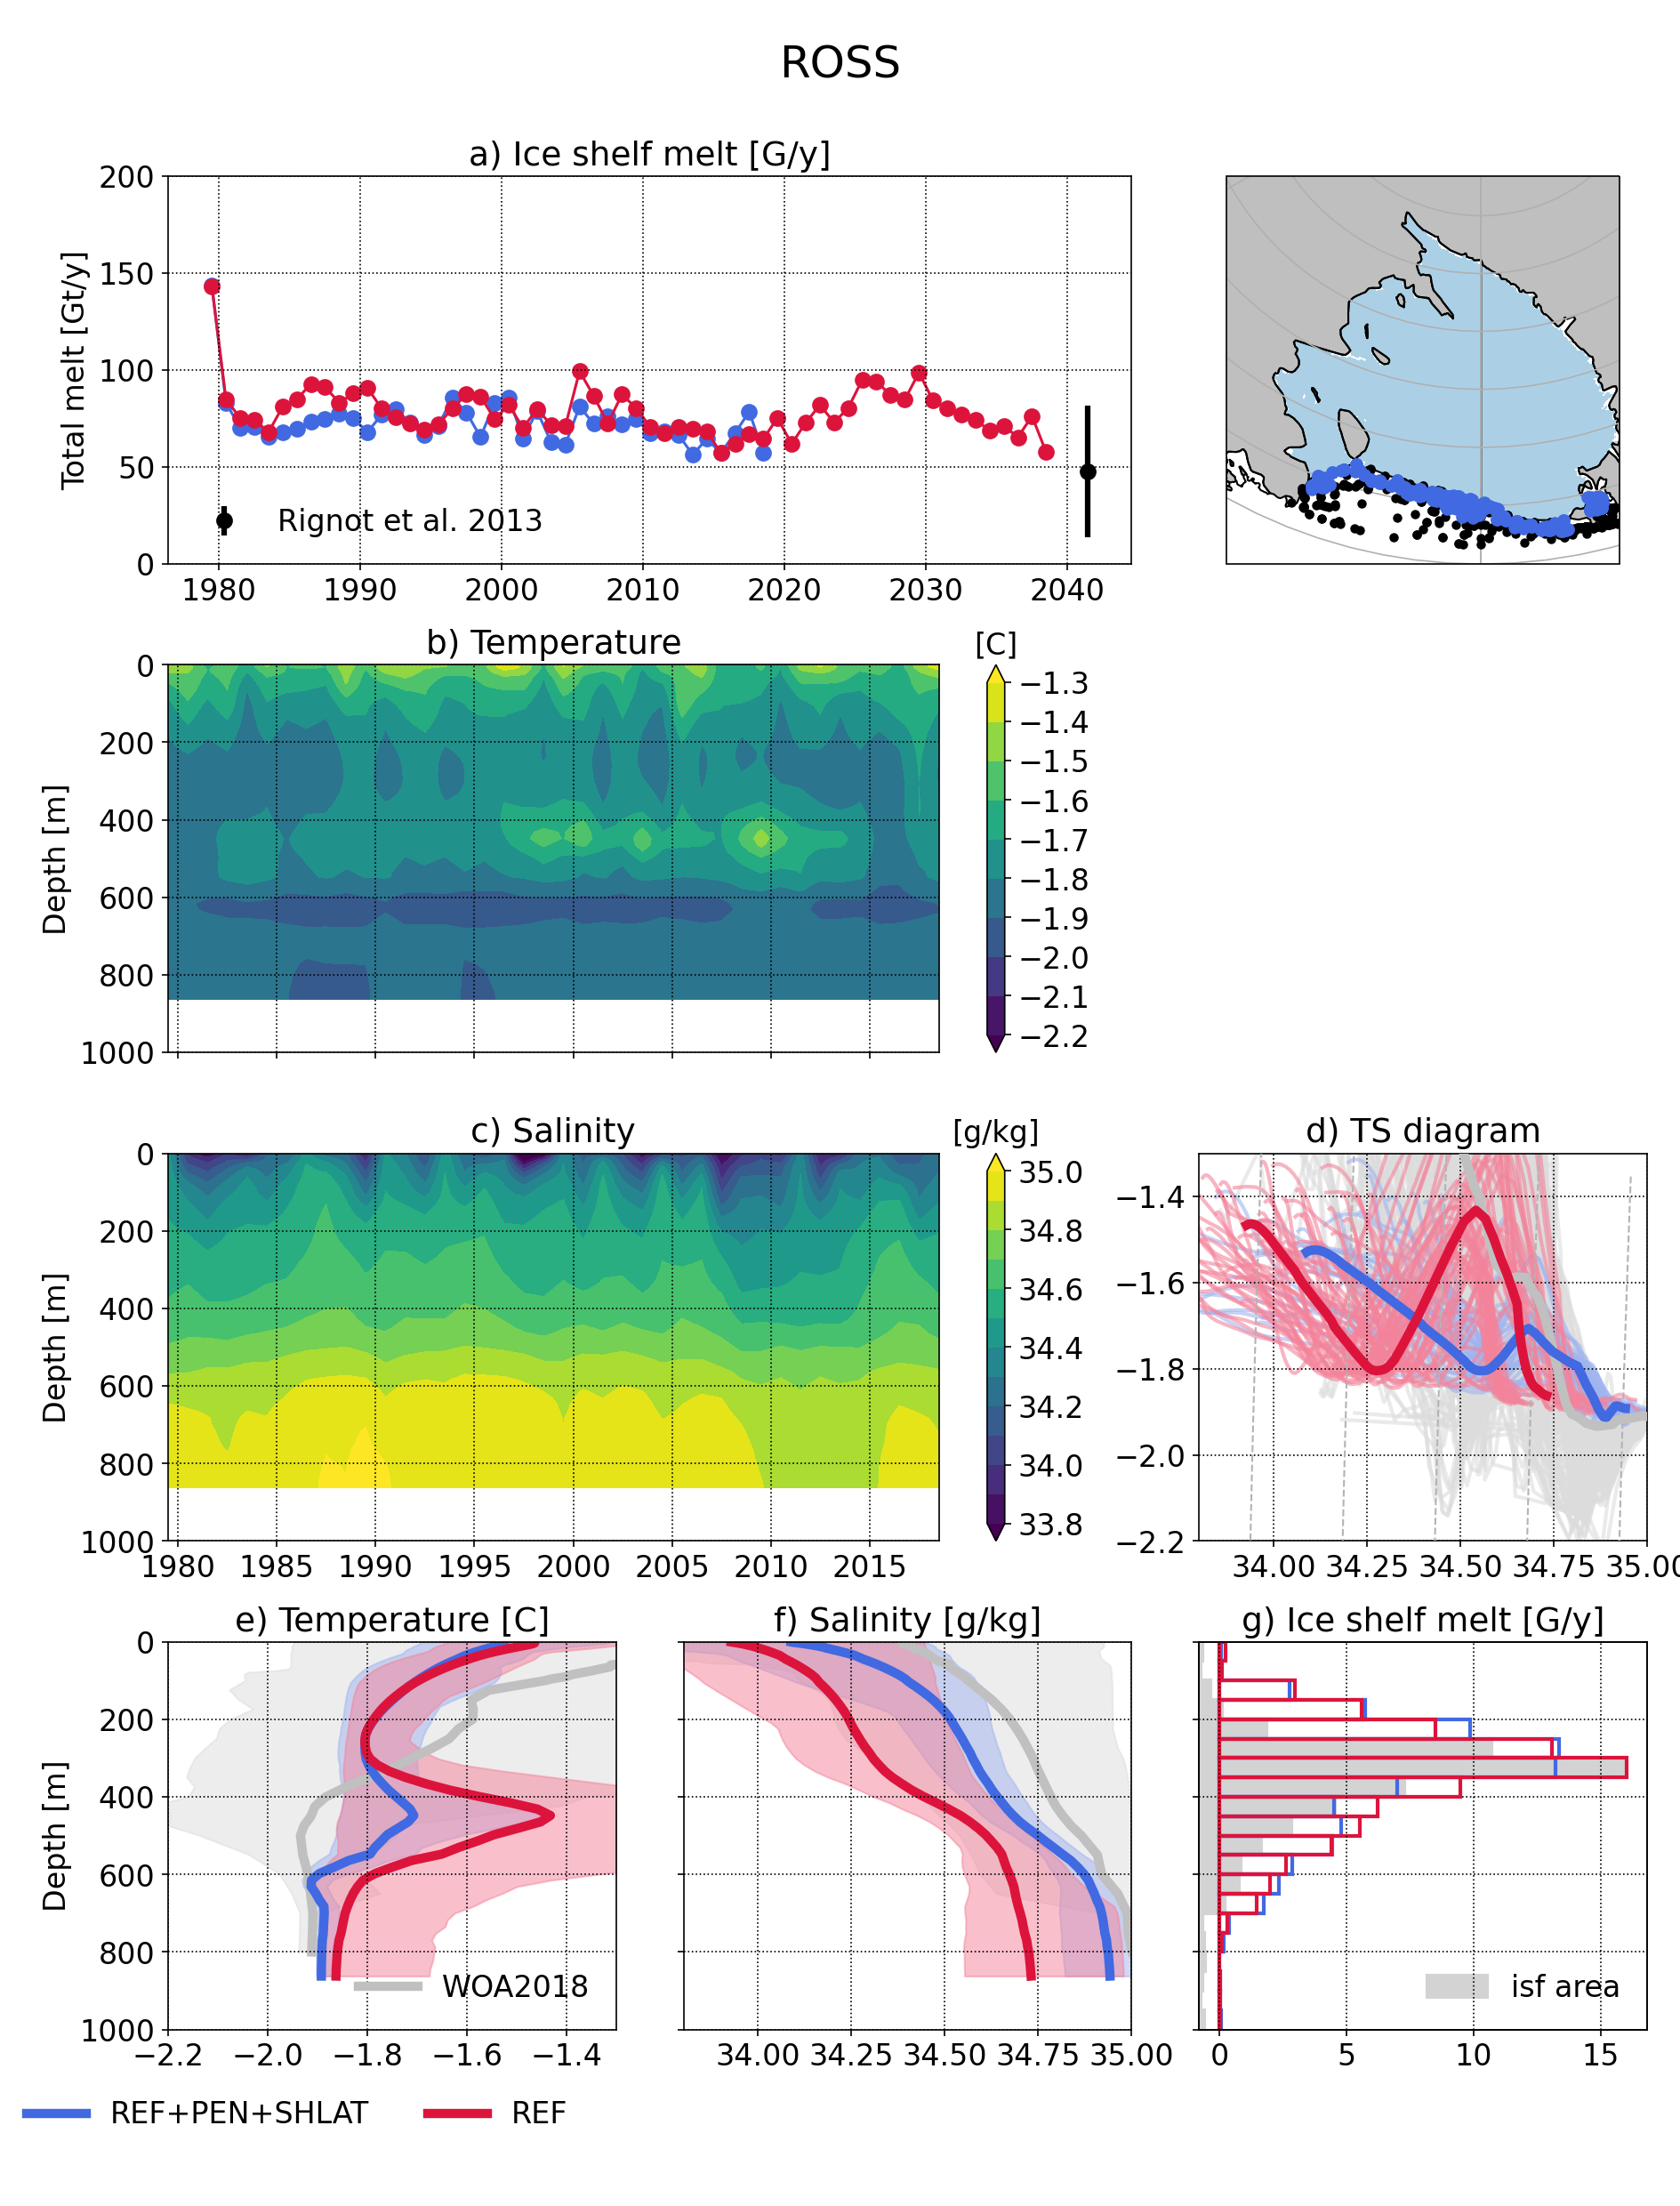
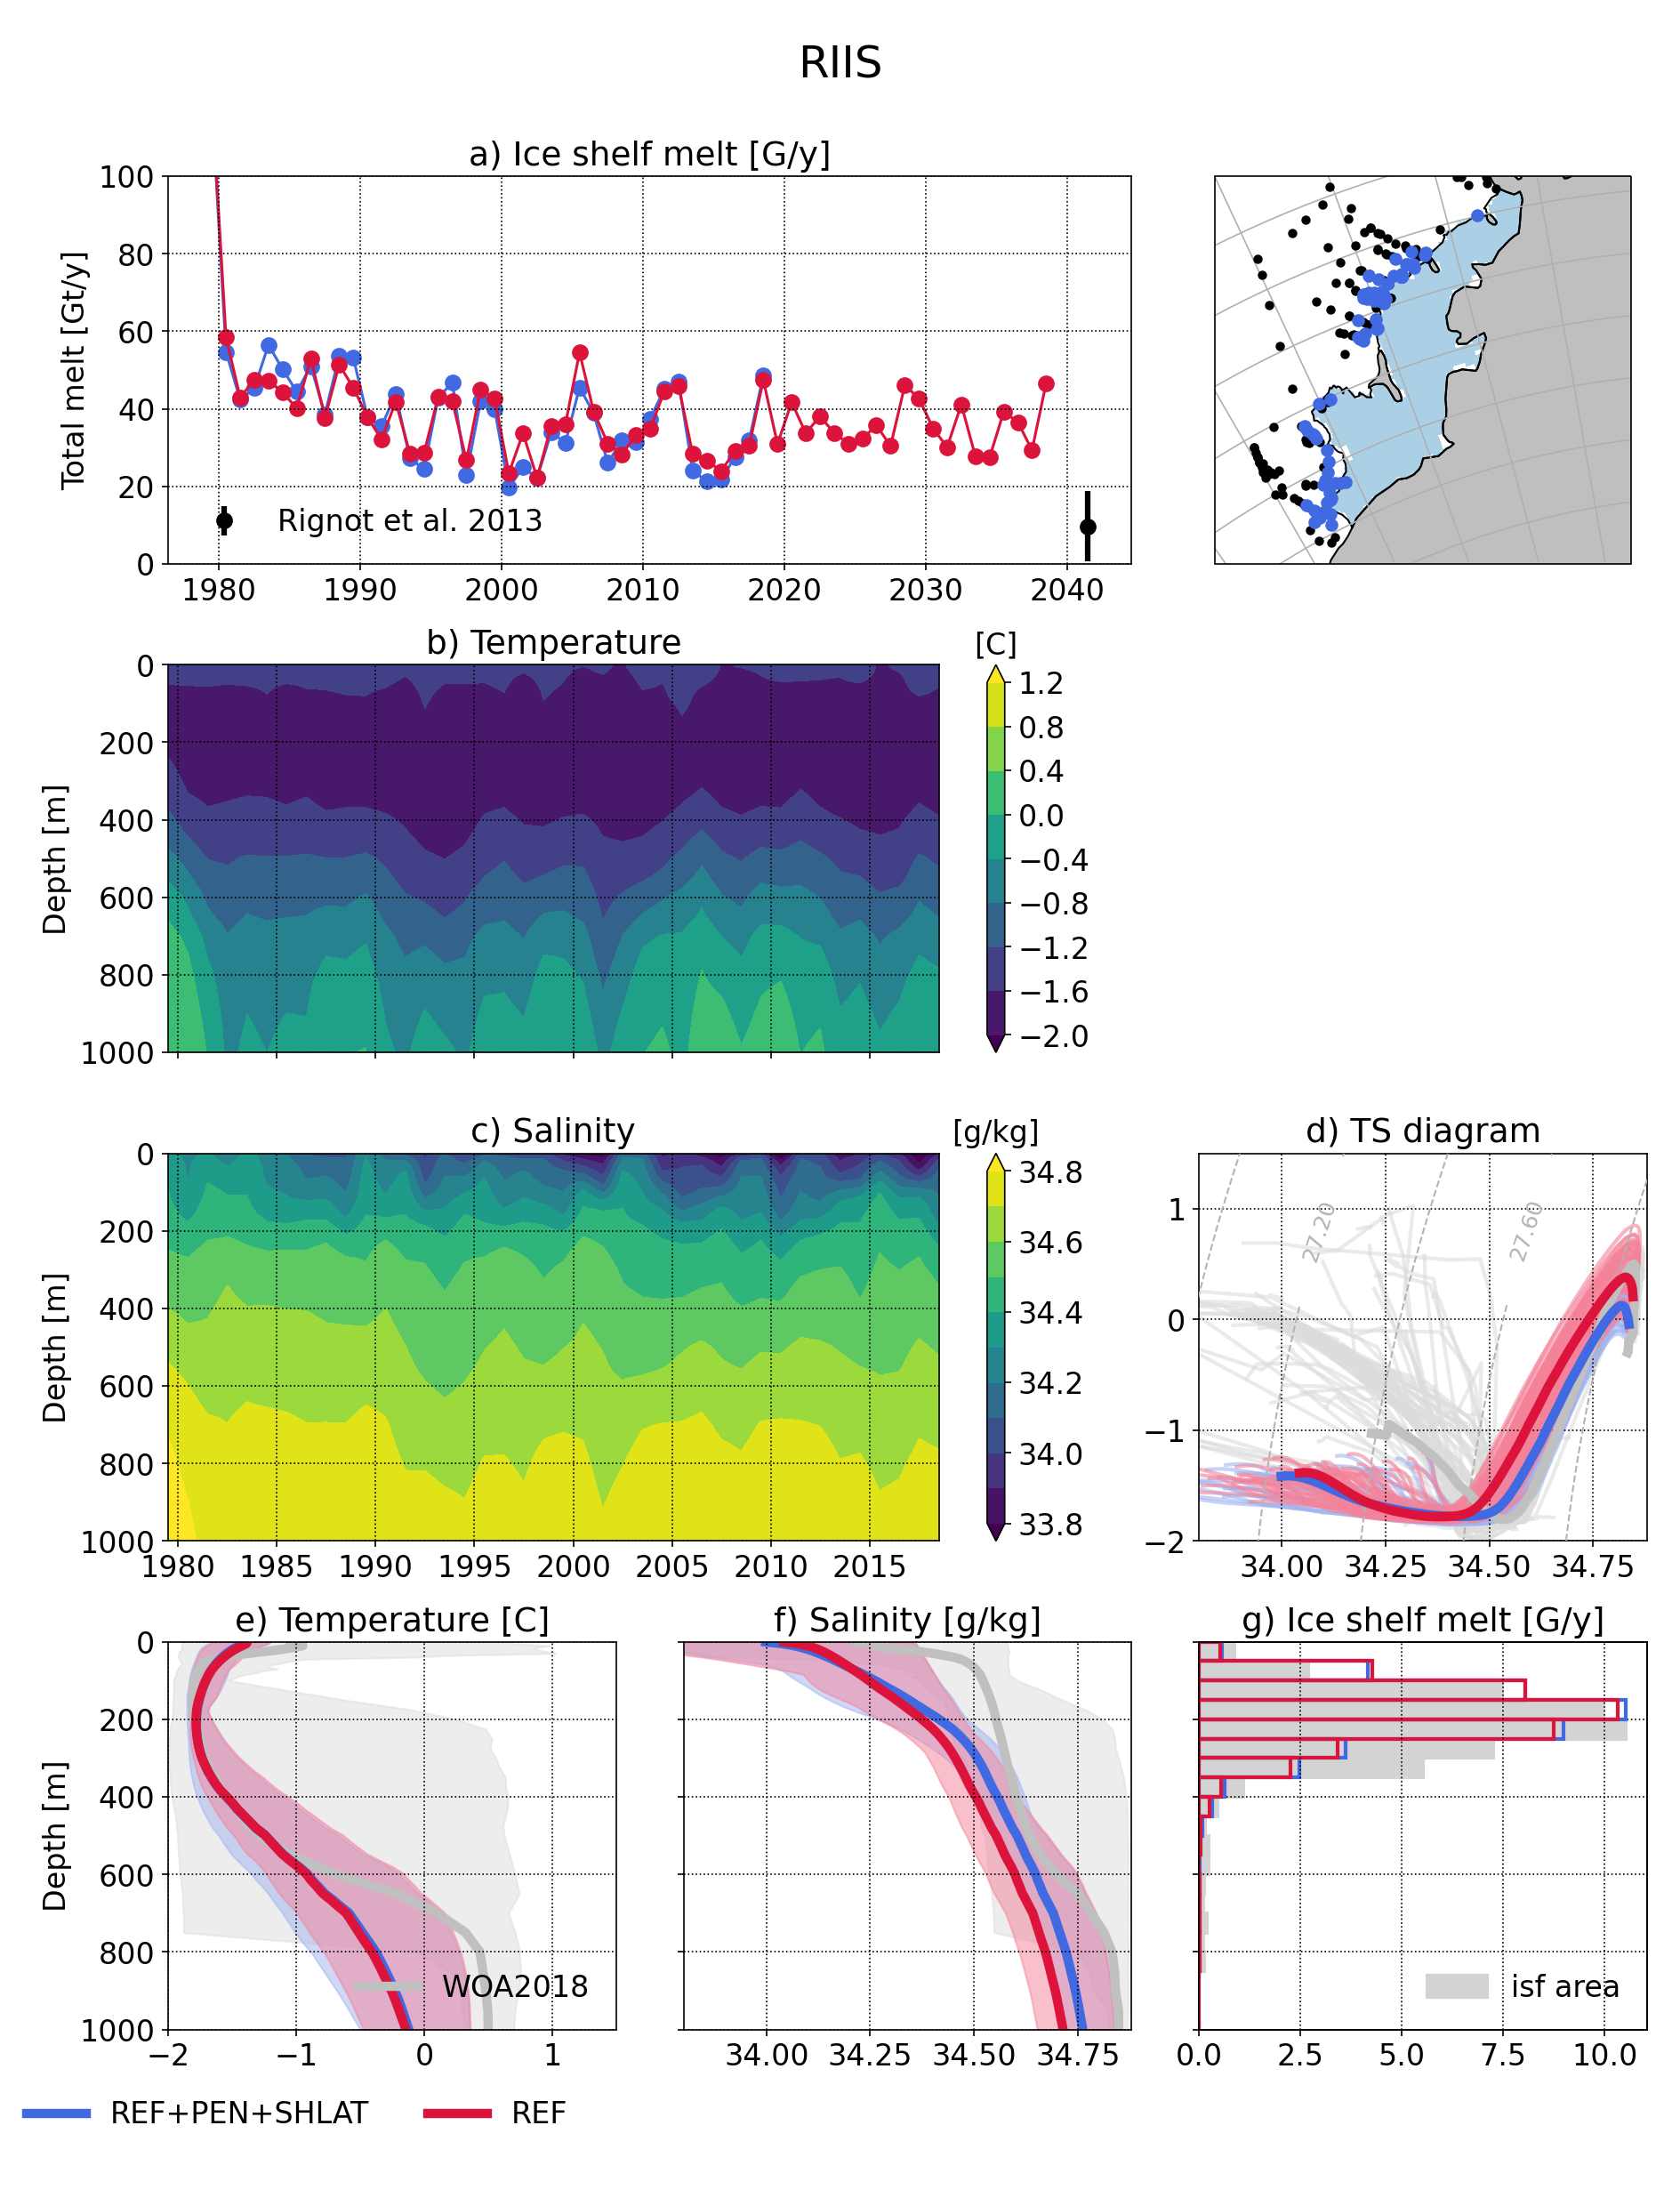
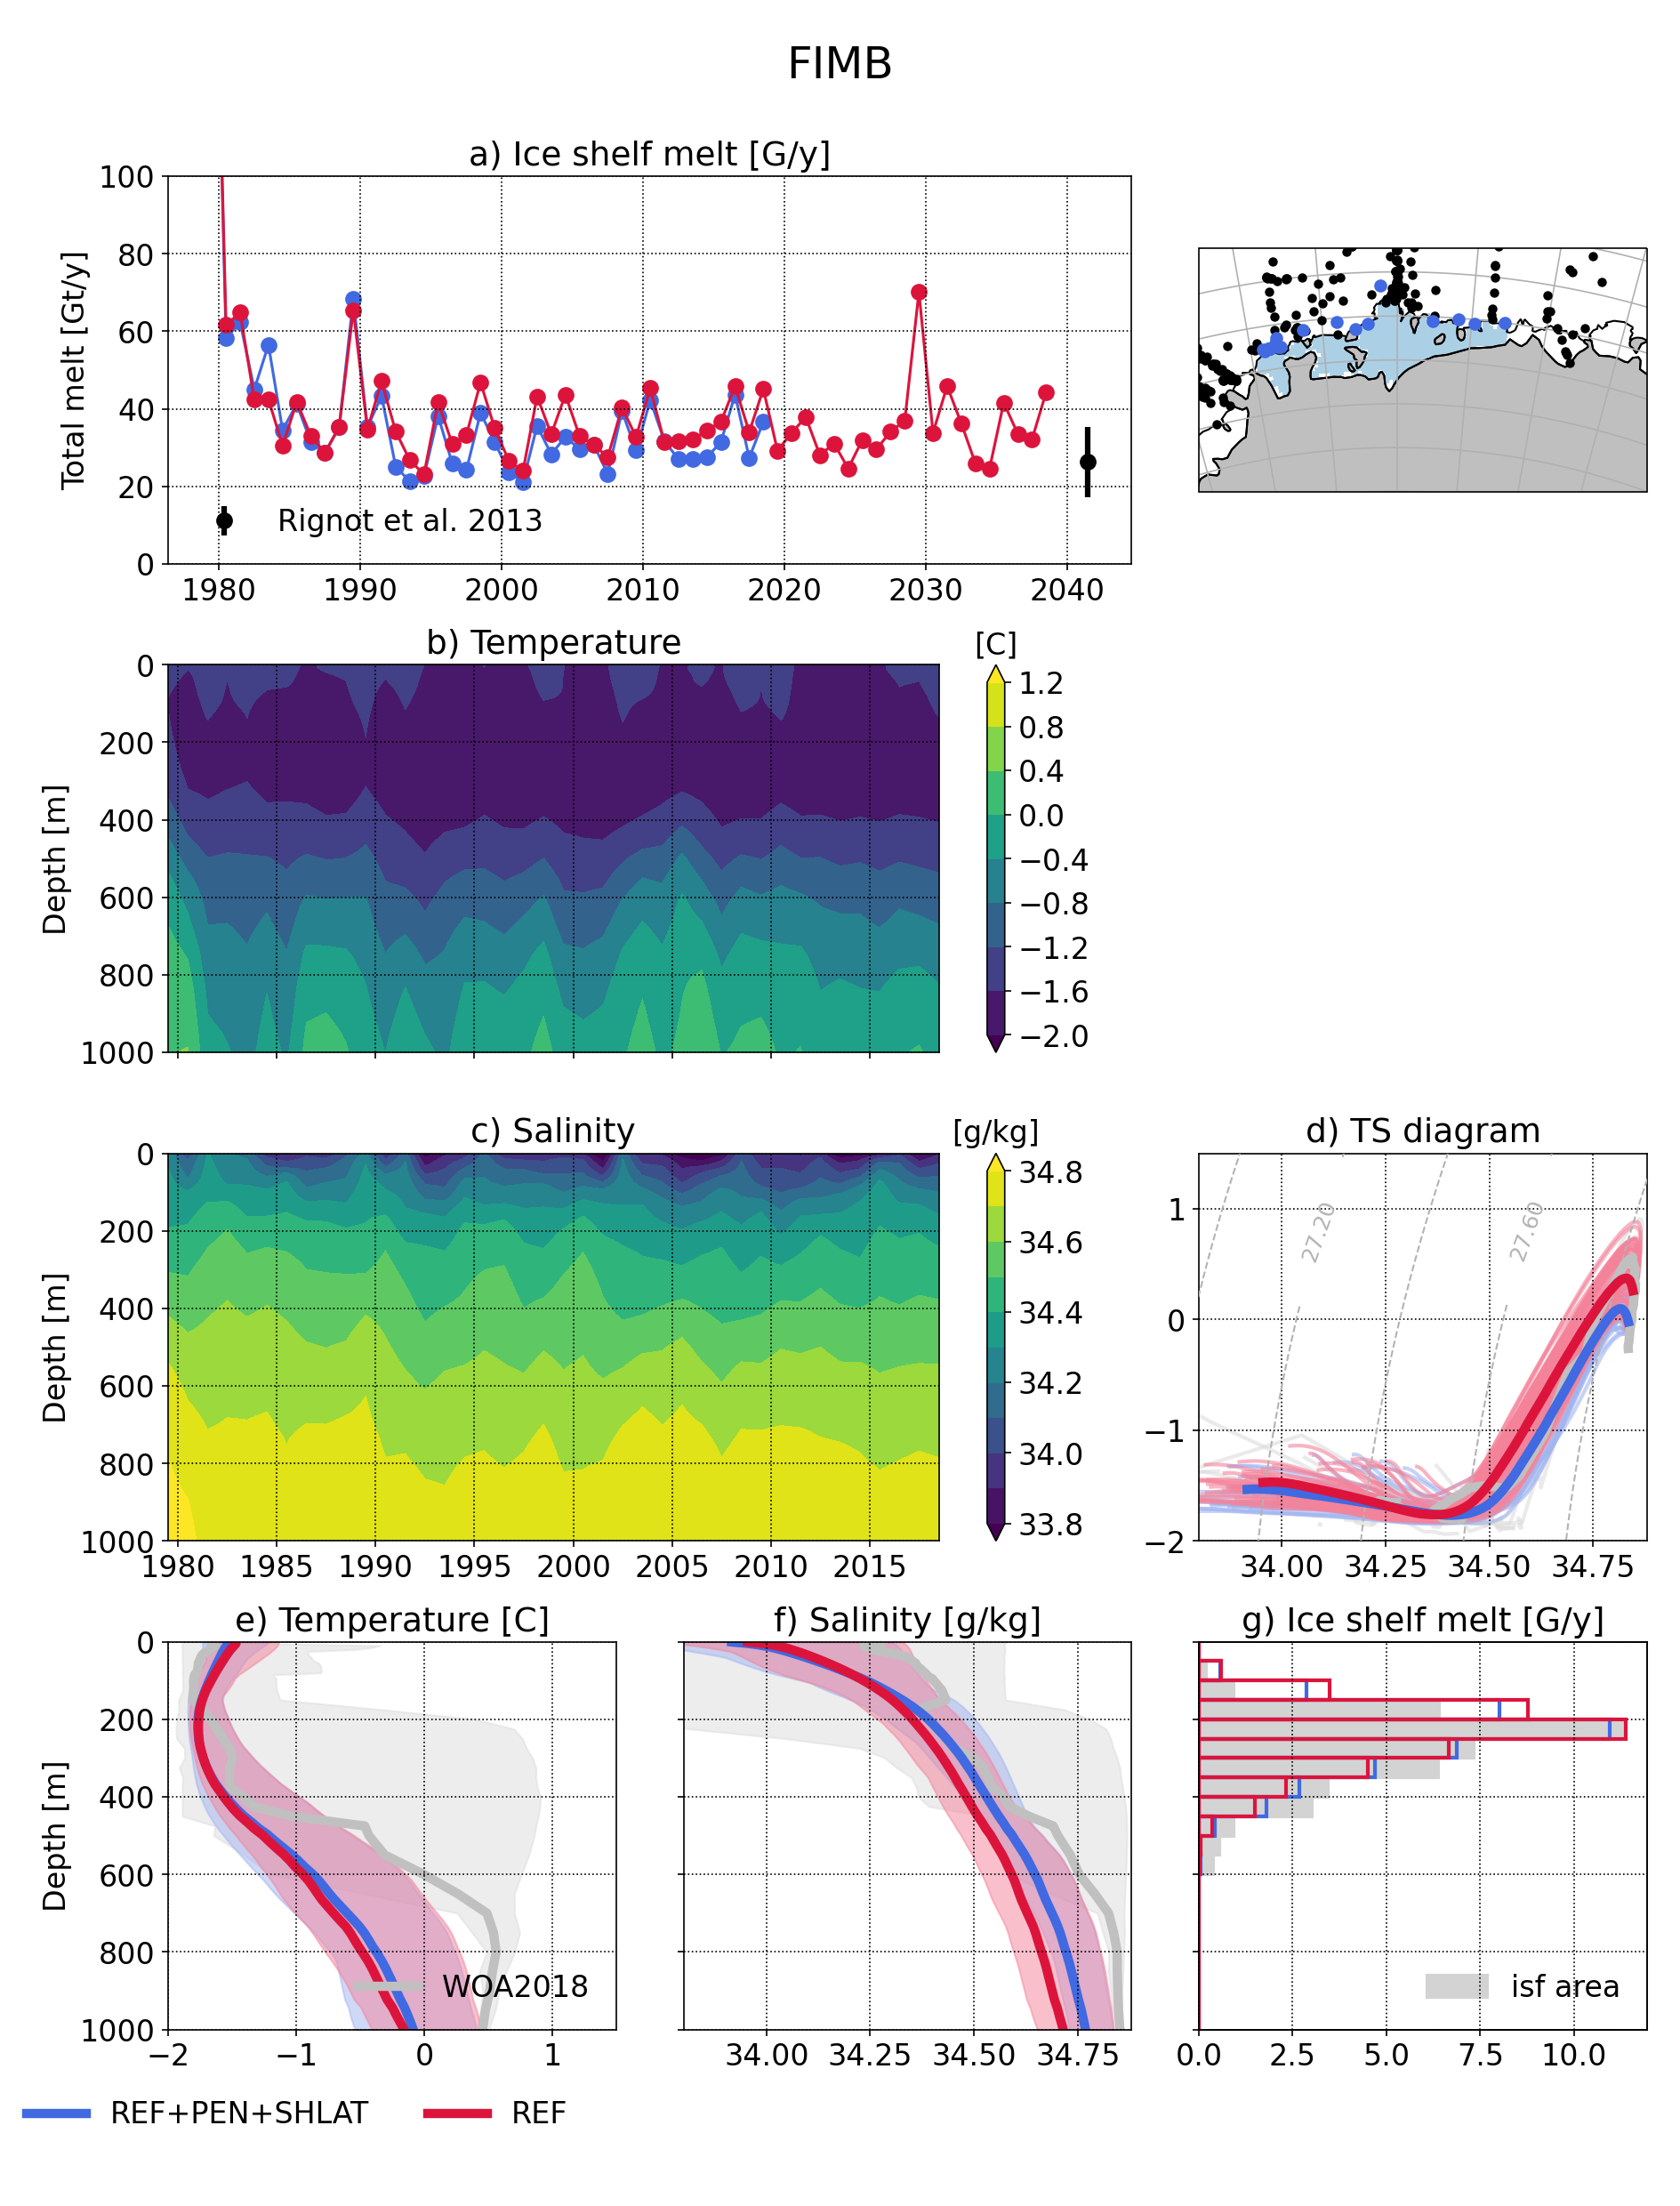
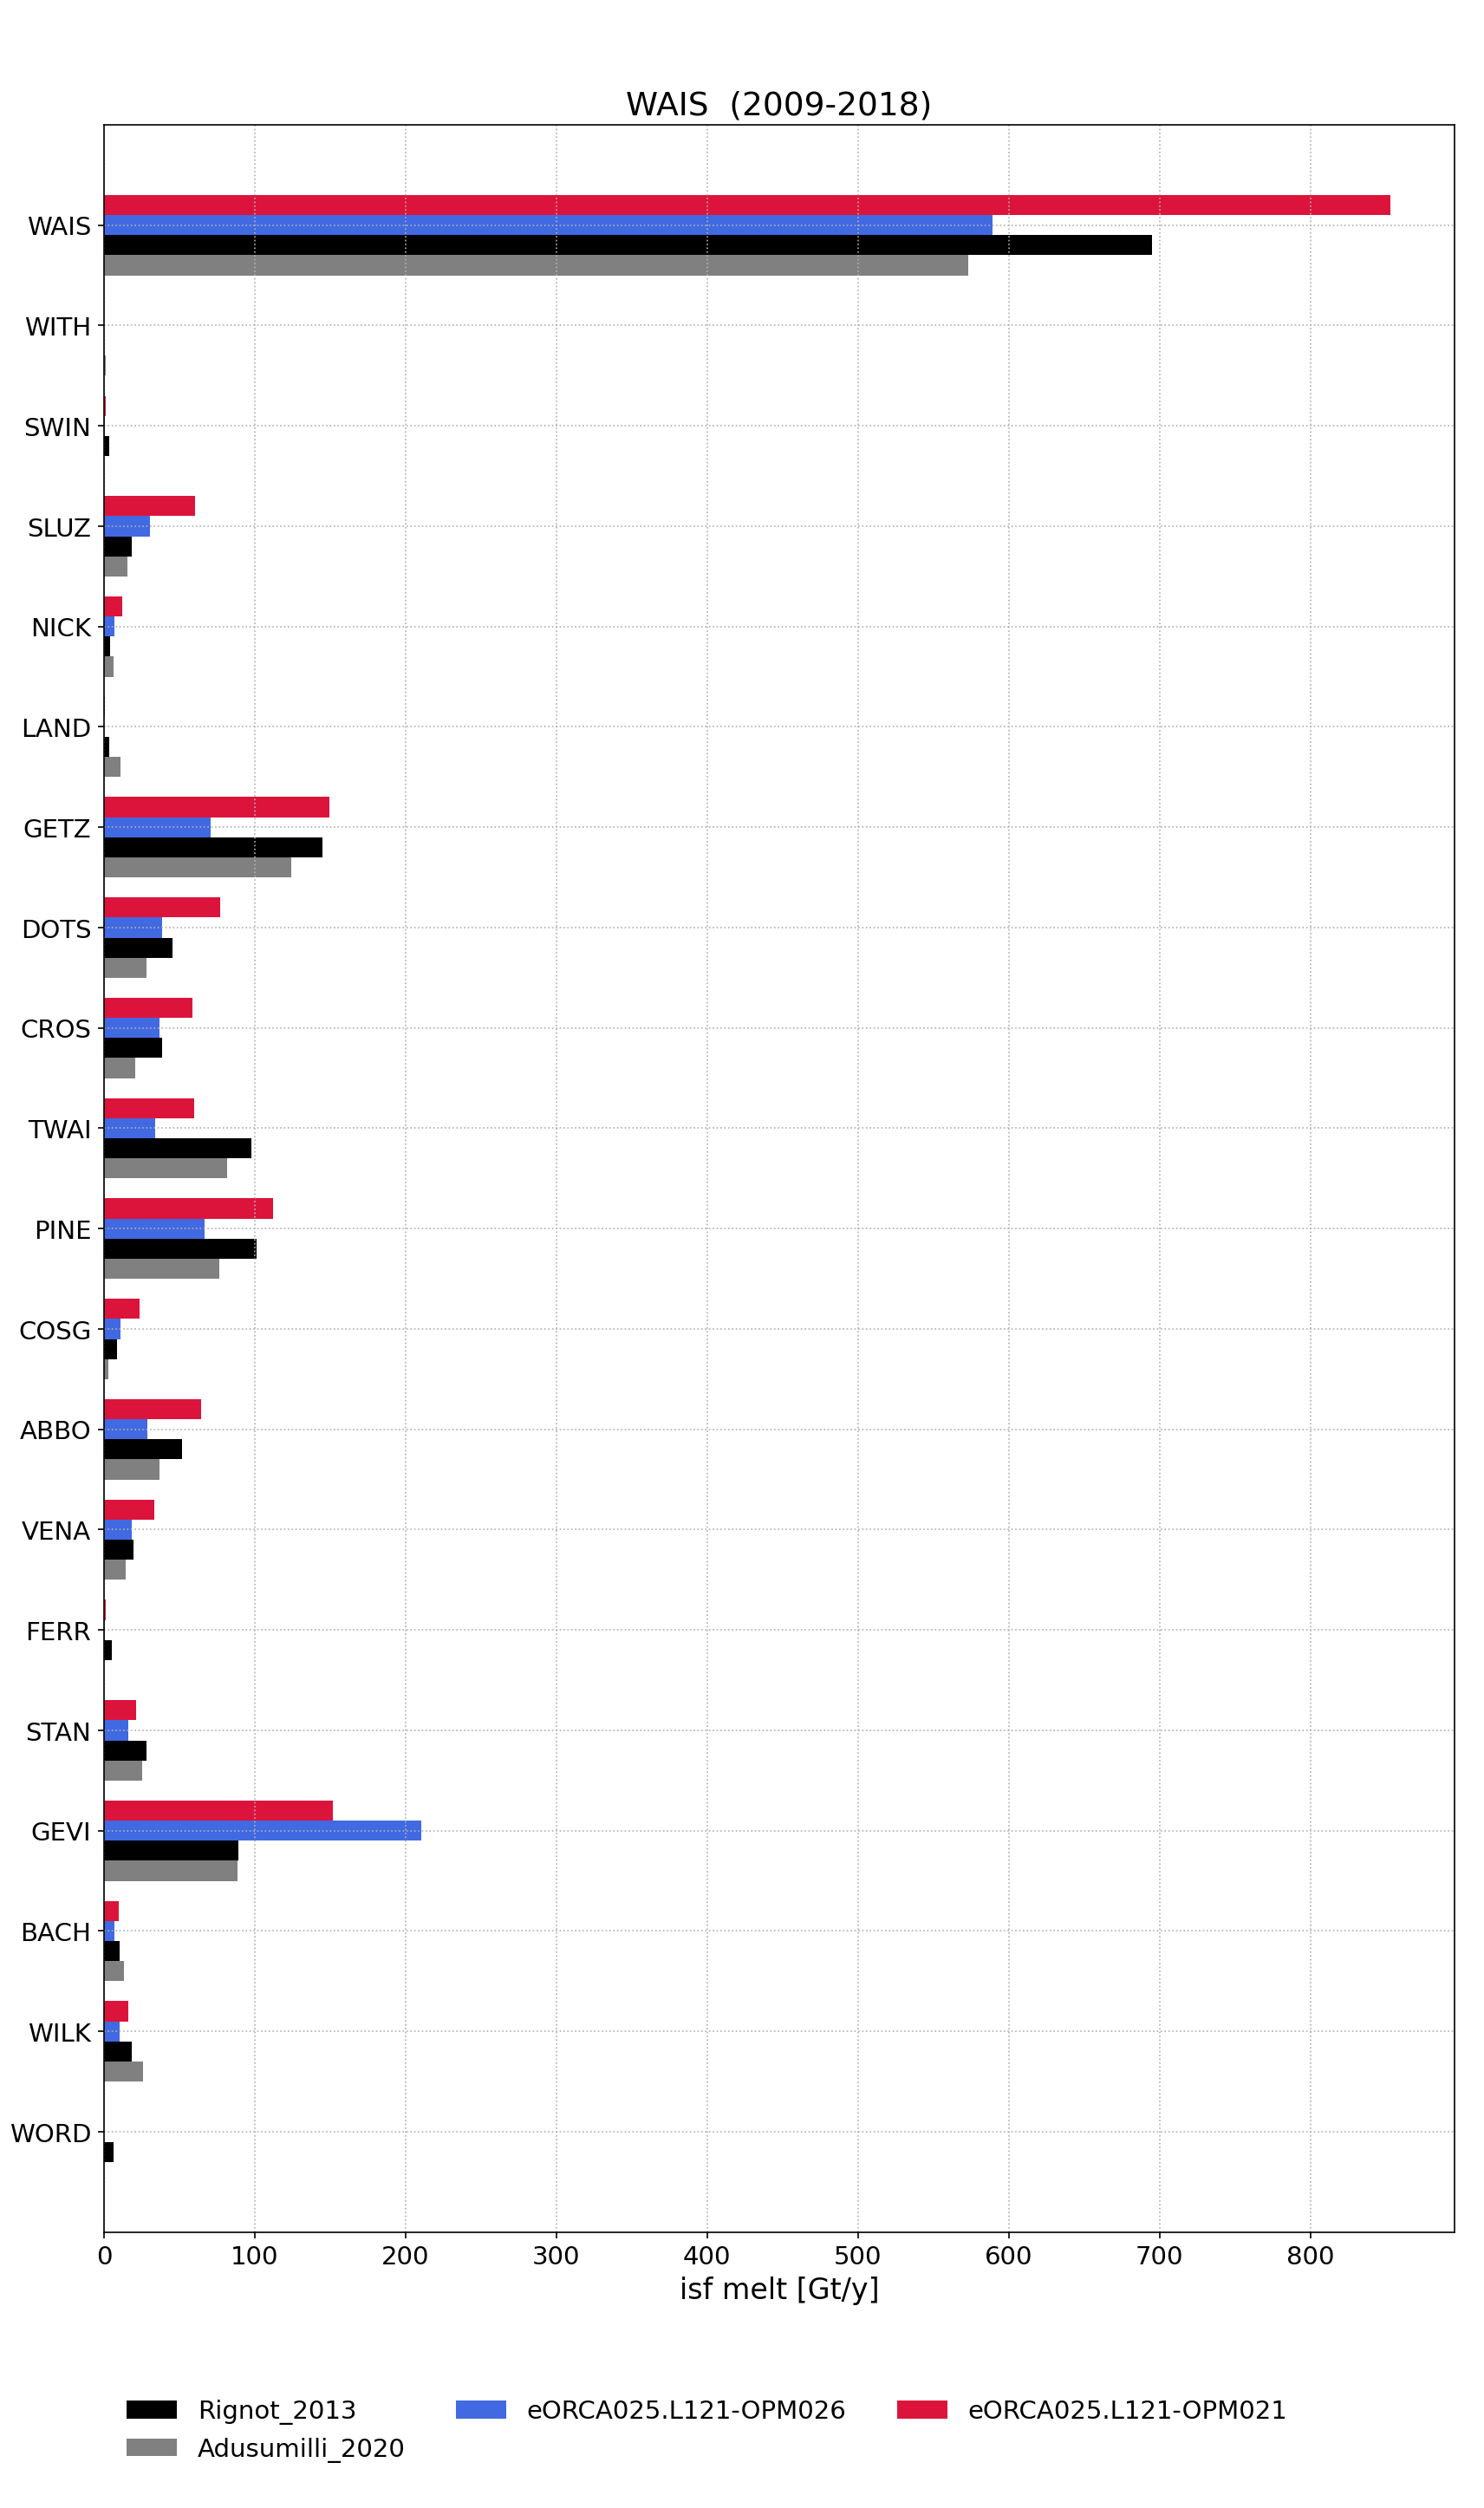
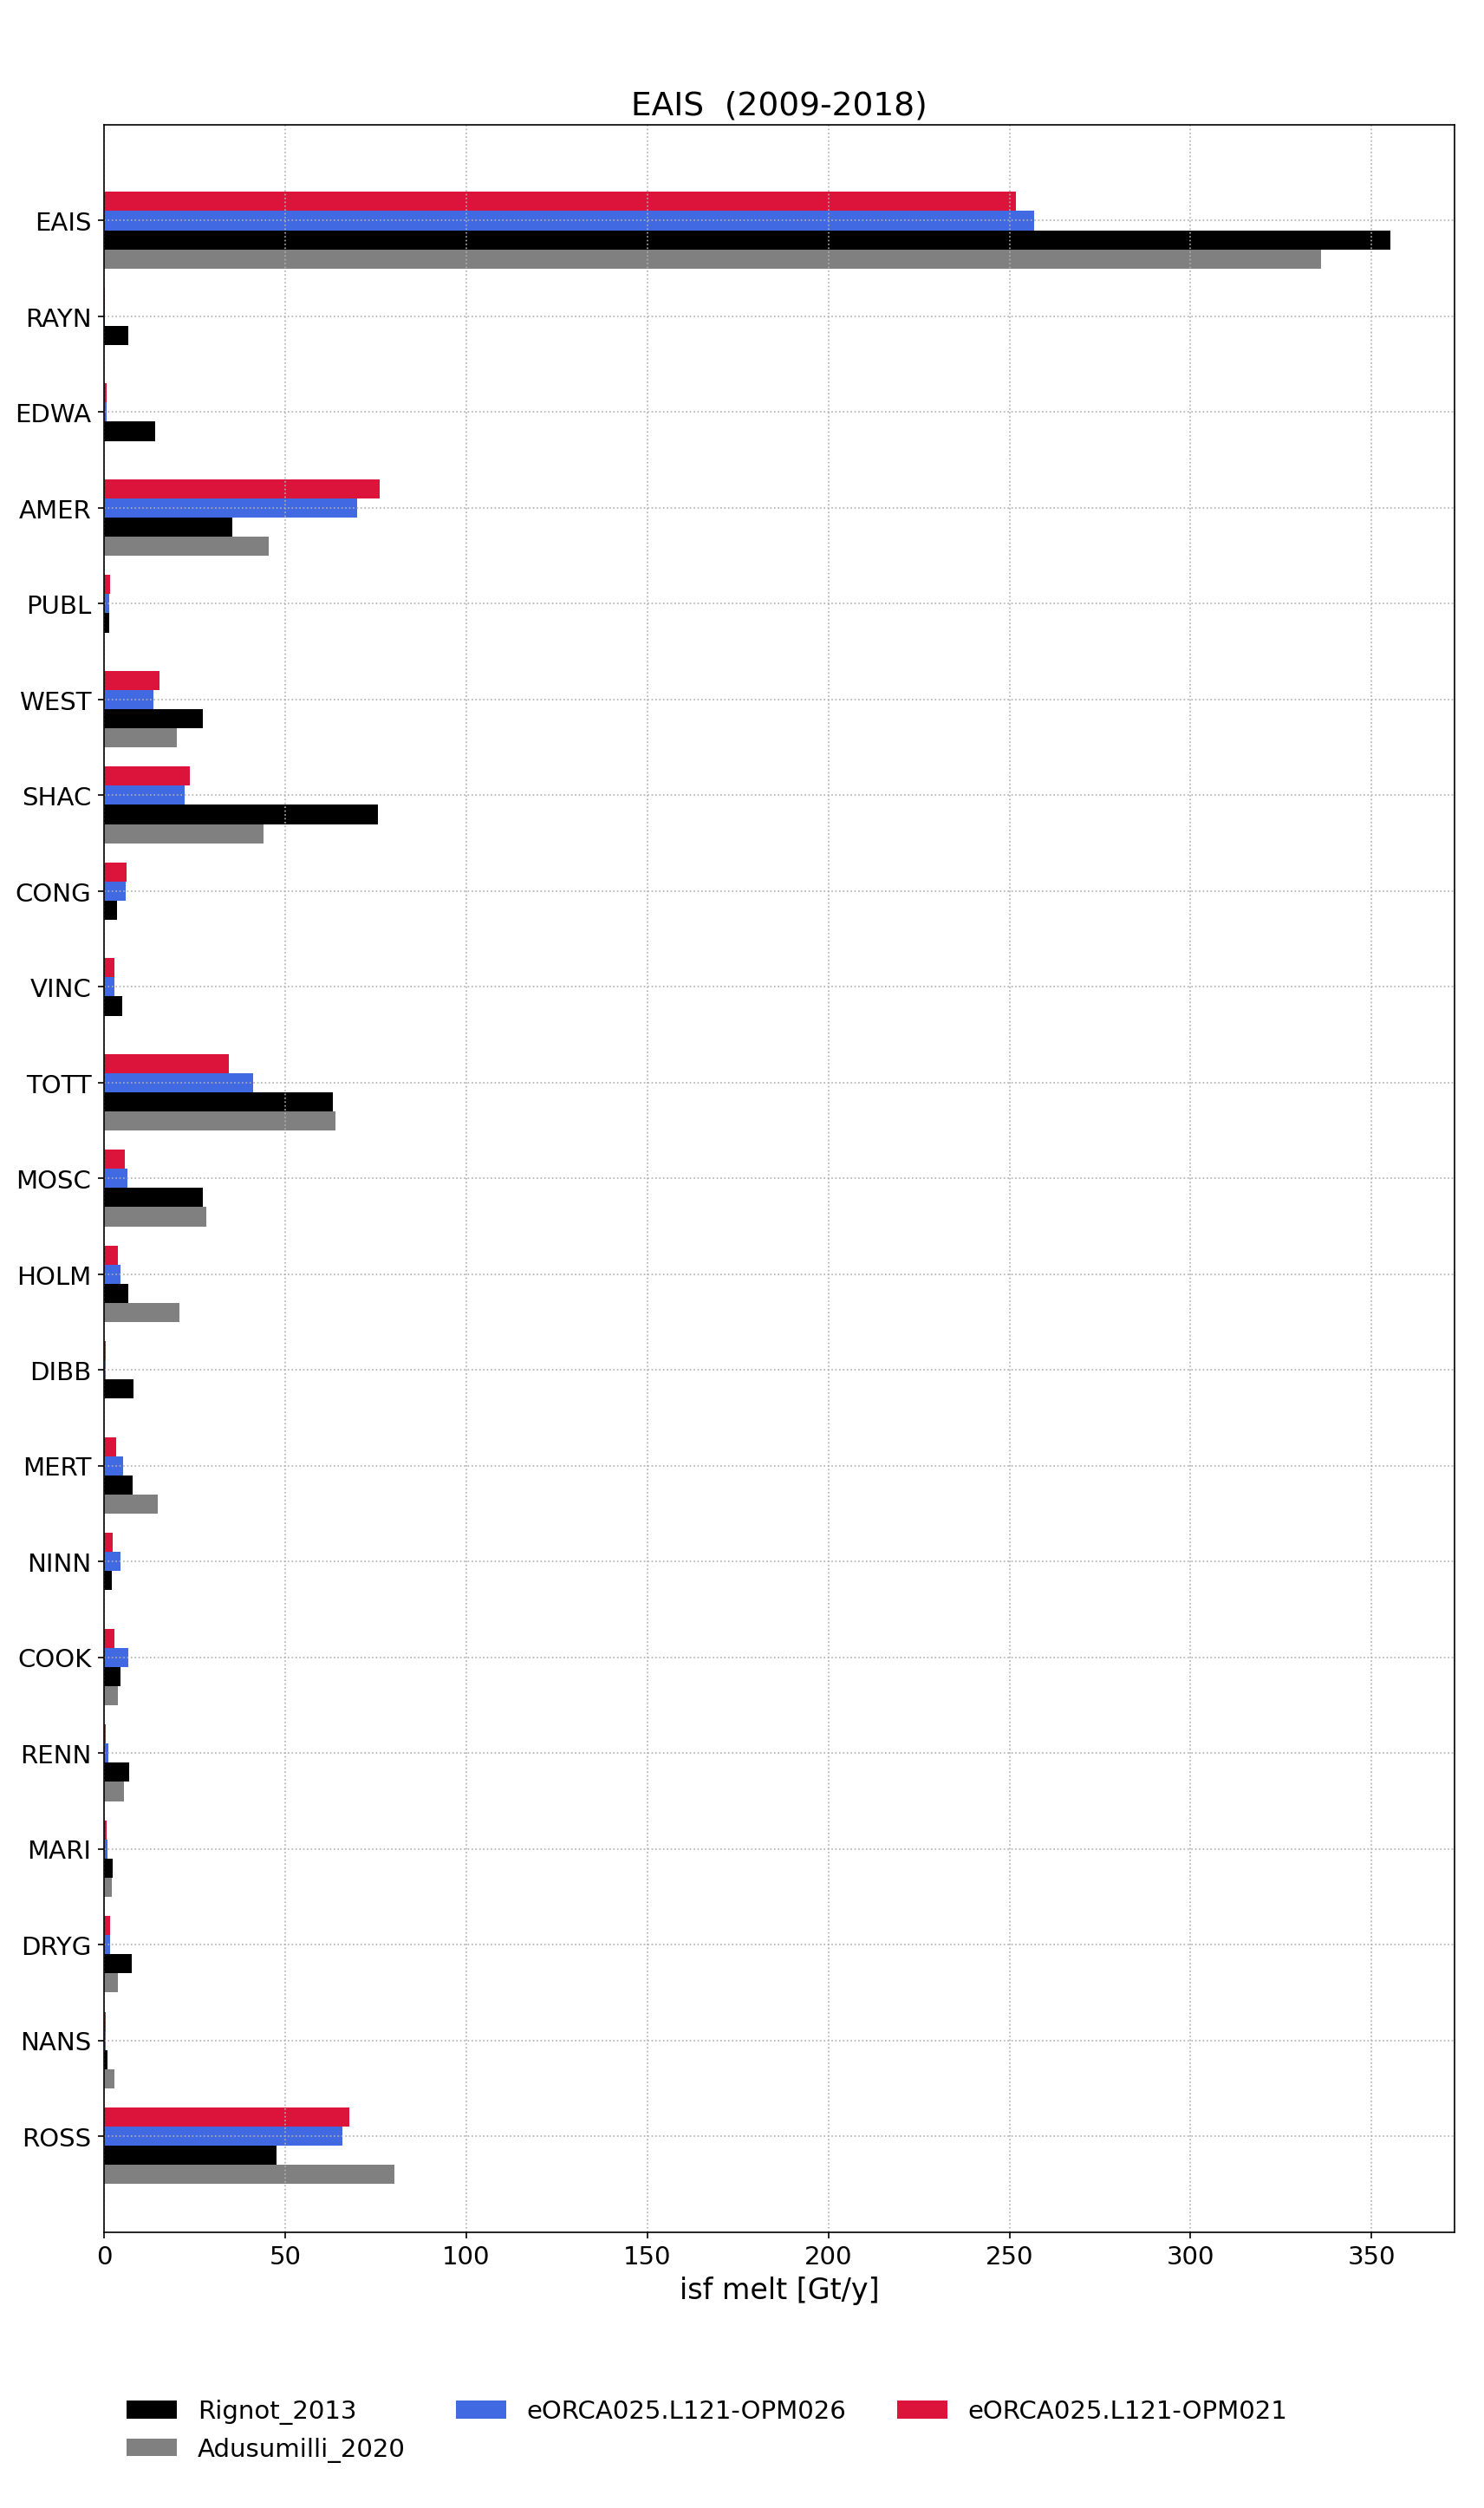
Evaluation
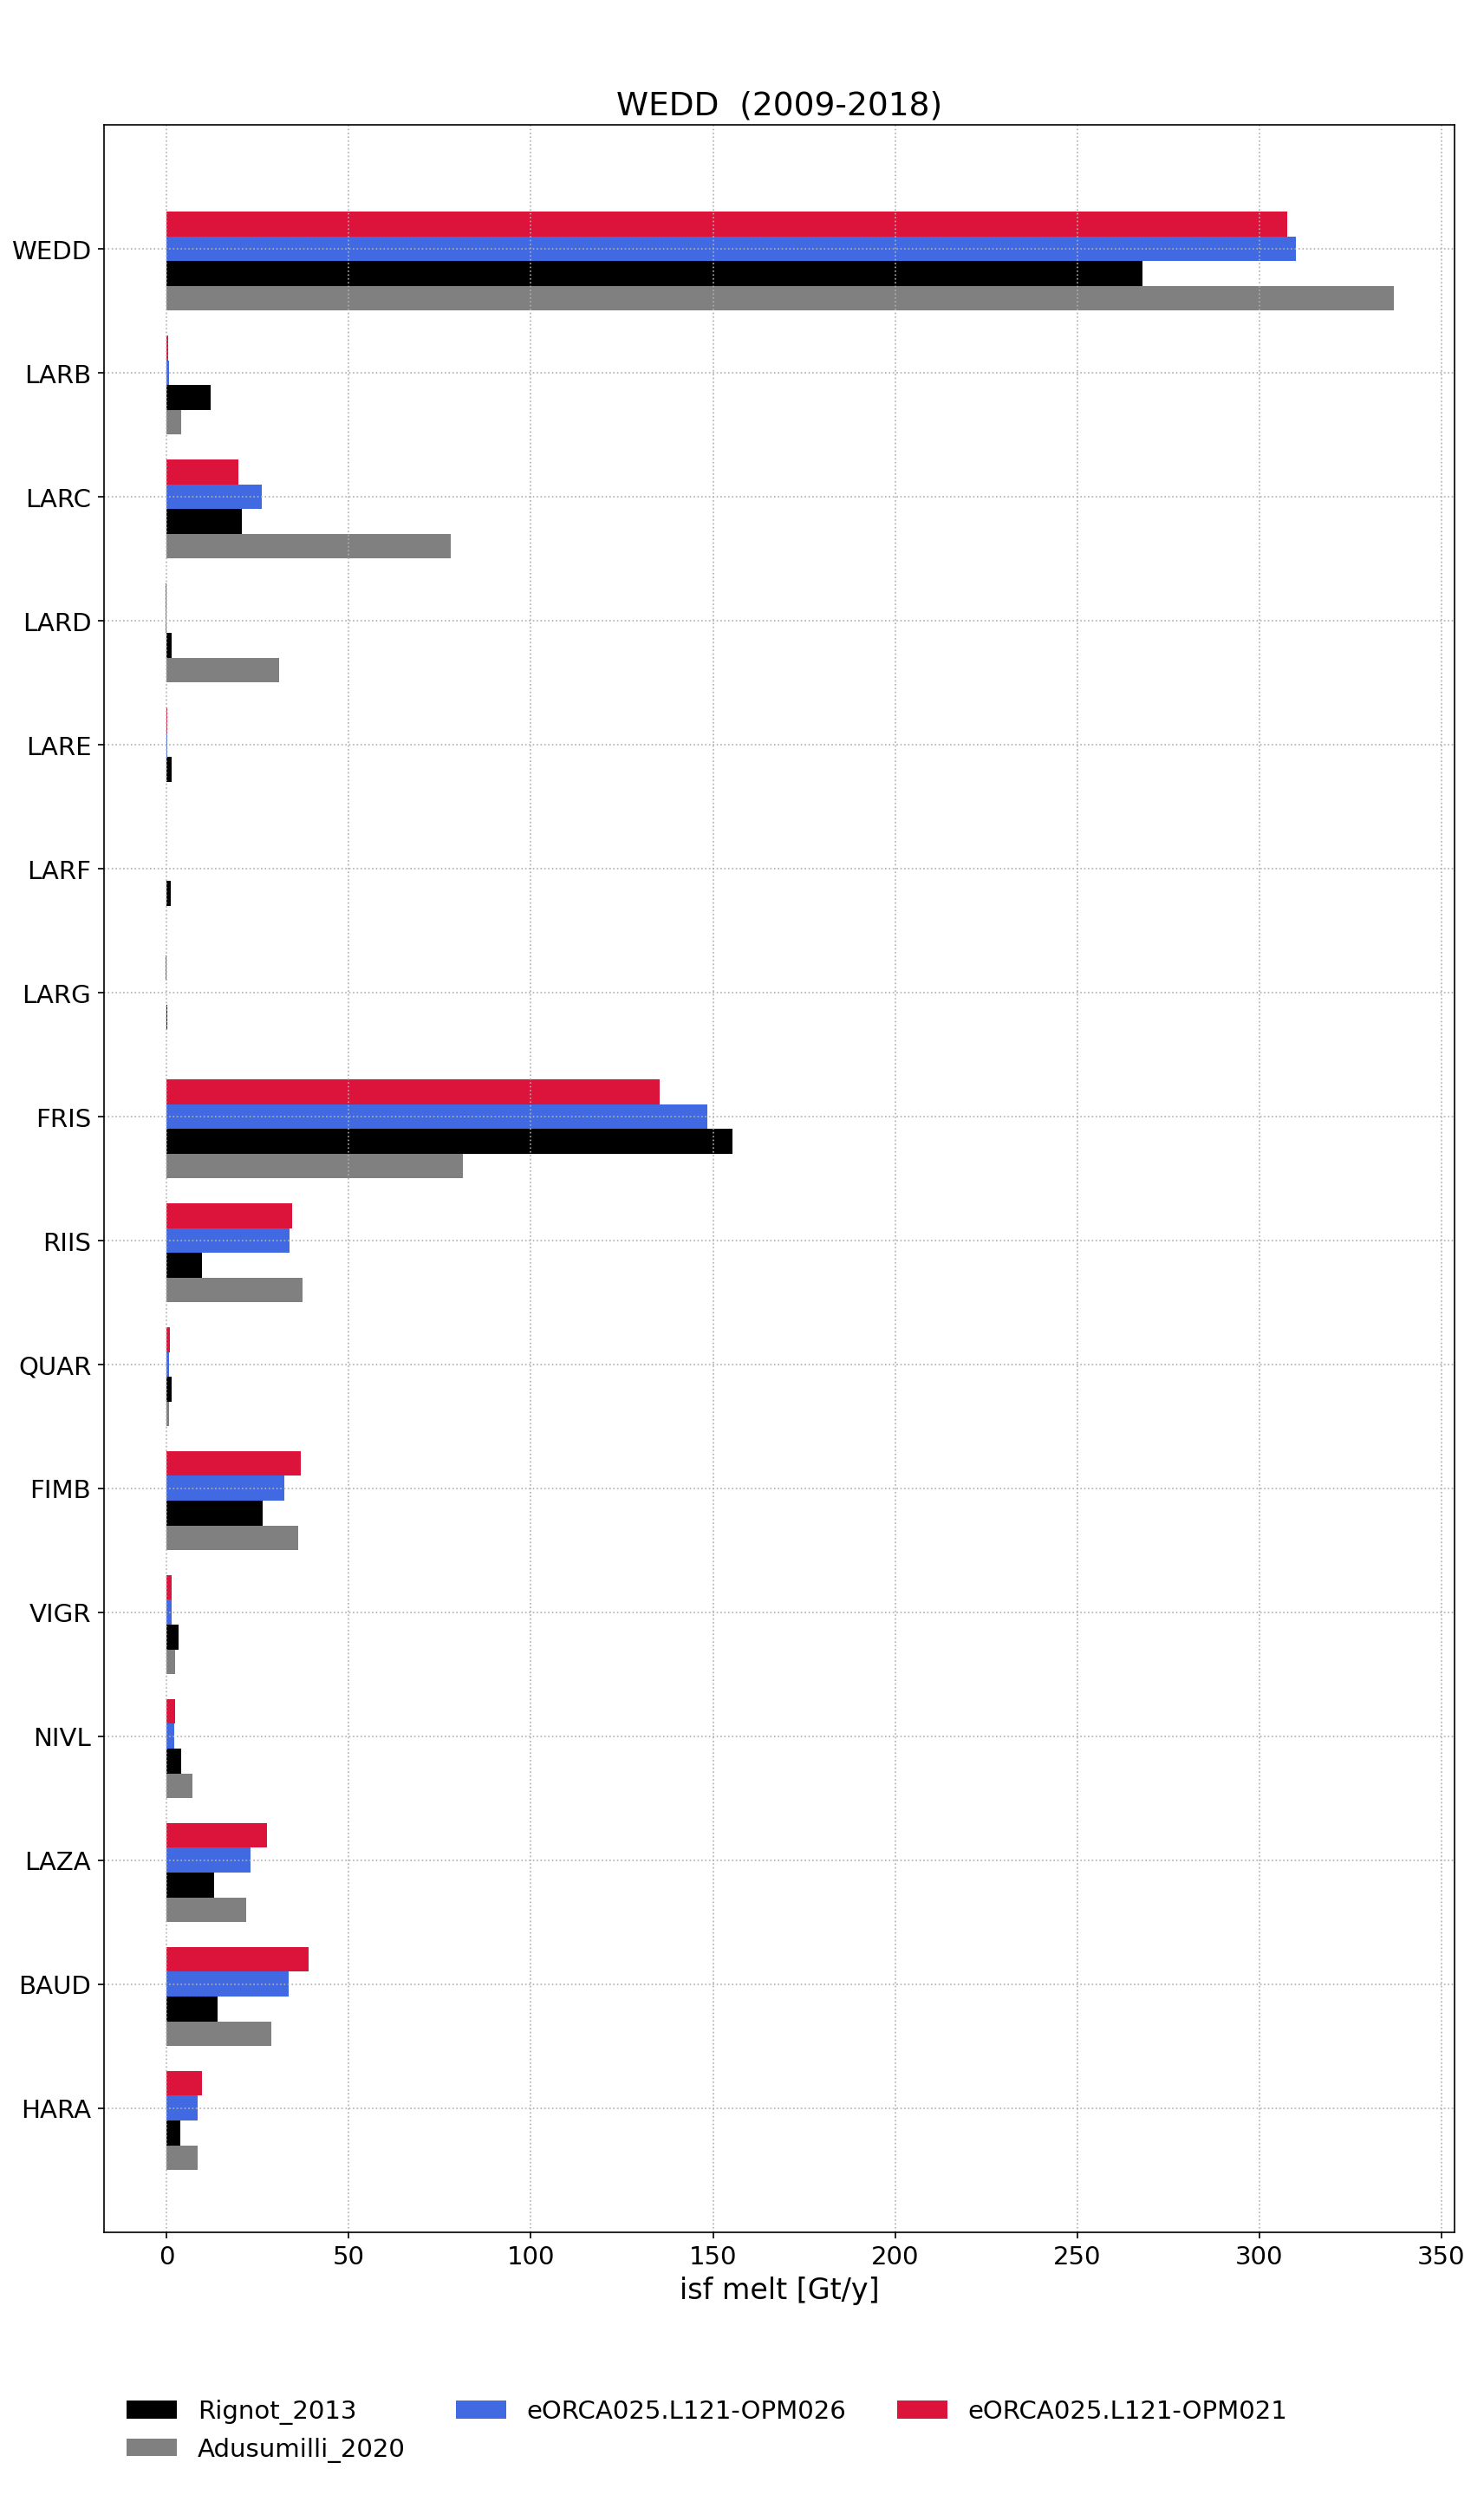
Ice shelf melt: the pictures below are the climatological melt for all the ice shelves in NEMO for the OPM026 and OPM021 simulations over the climatology (1989-1993) by sectors.
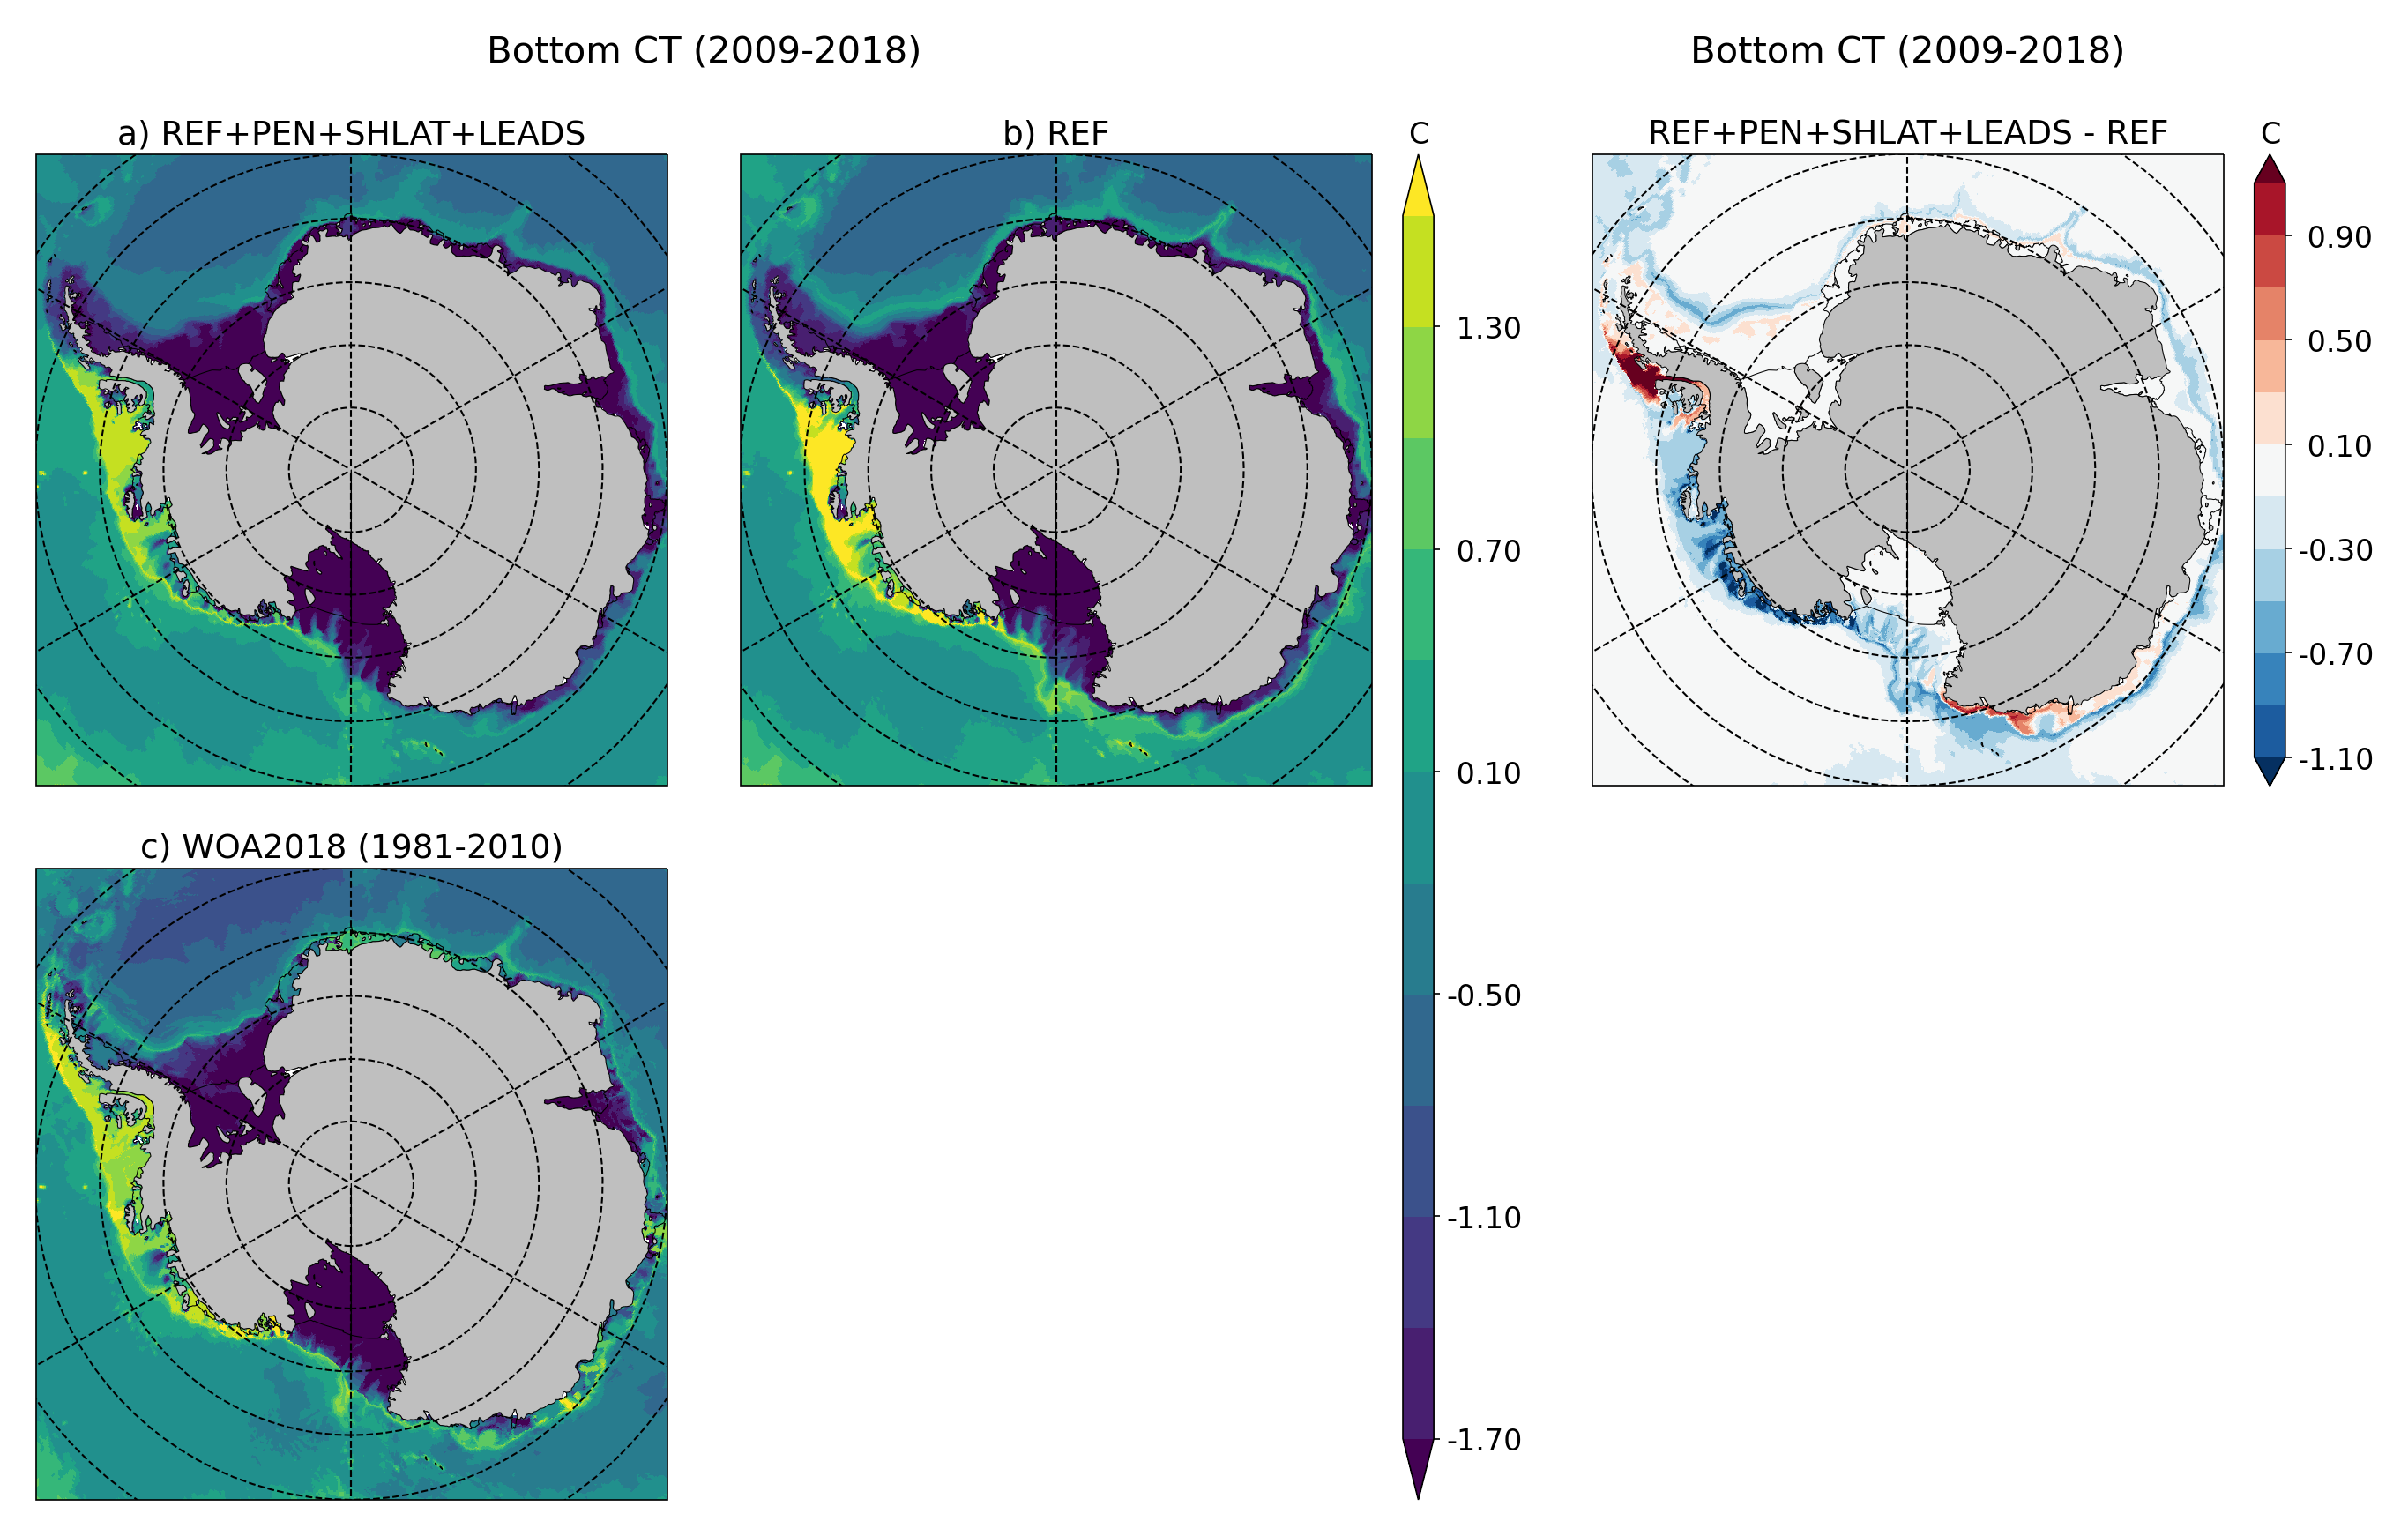
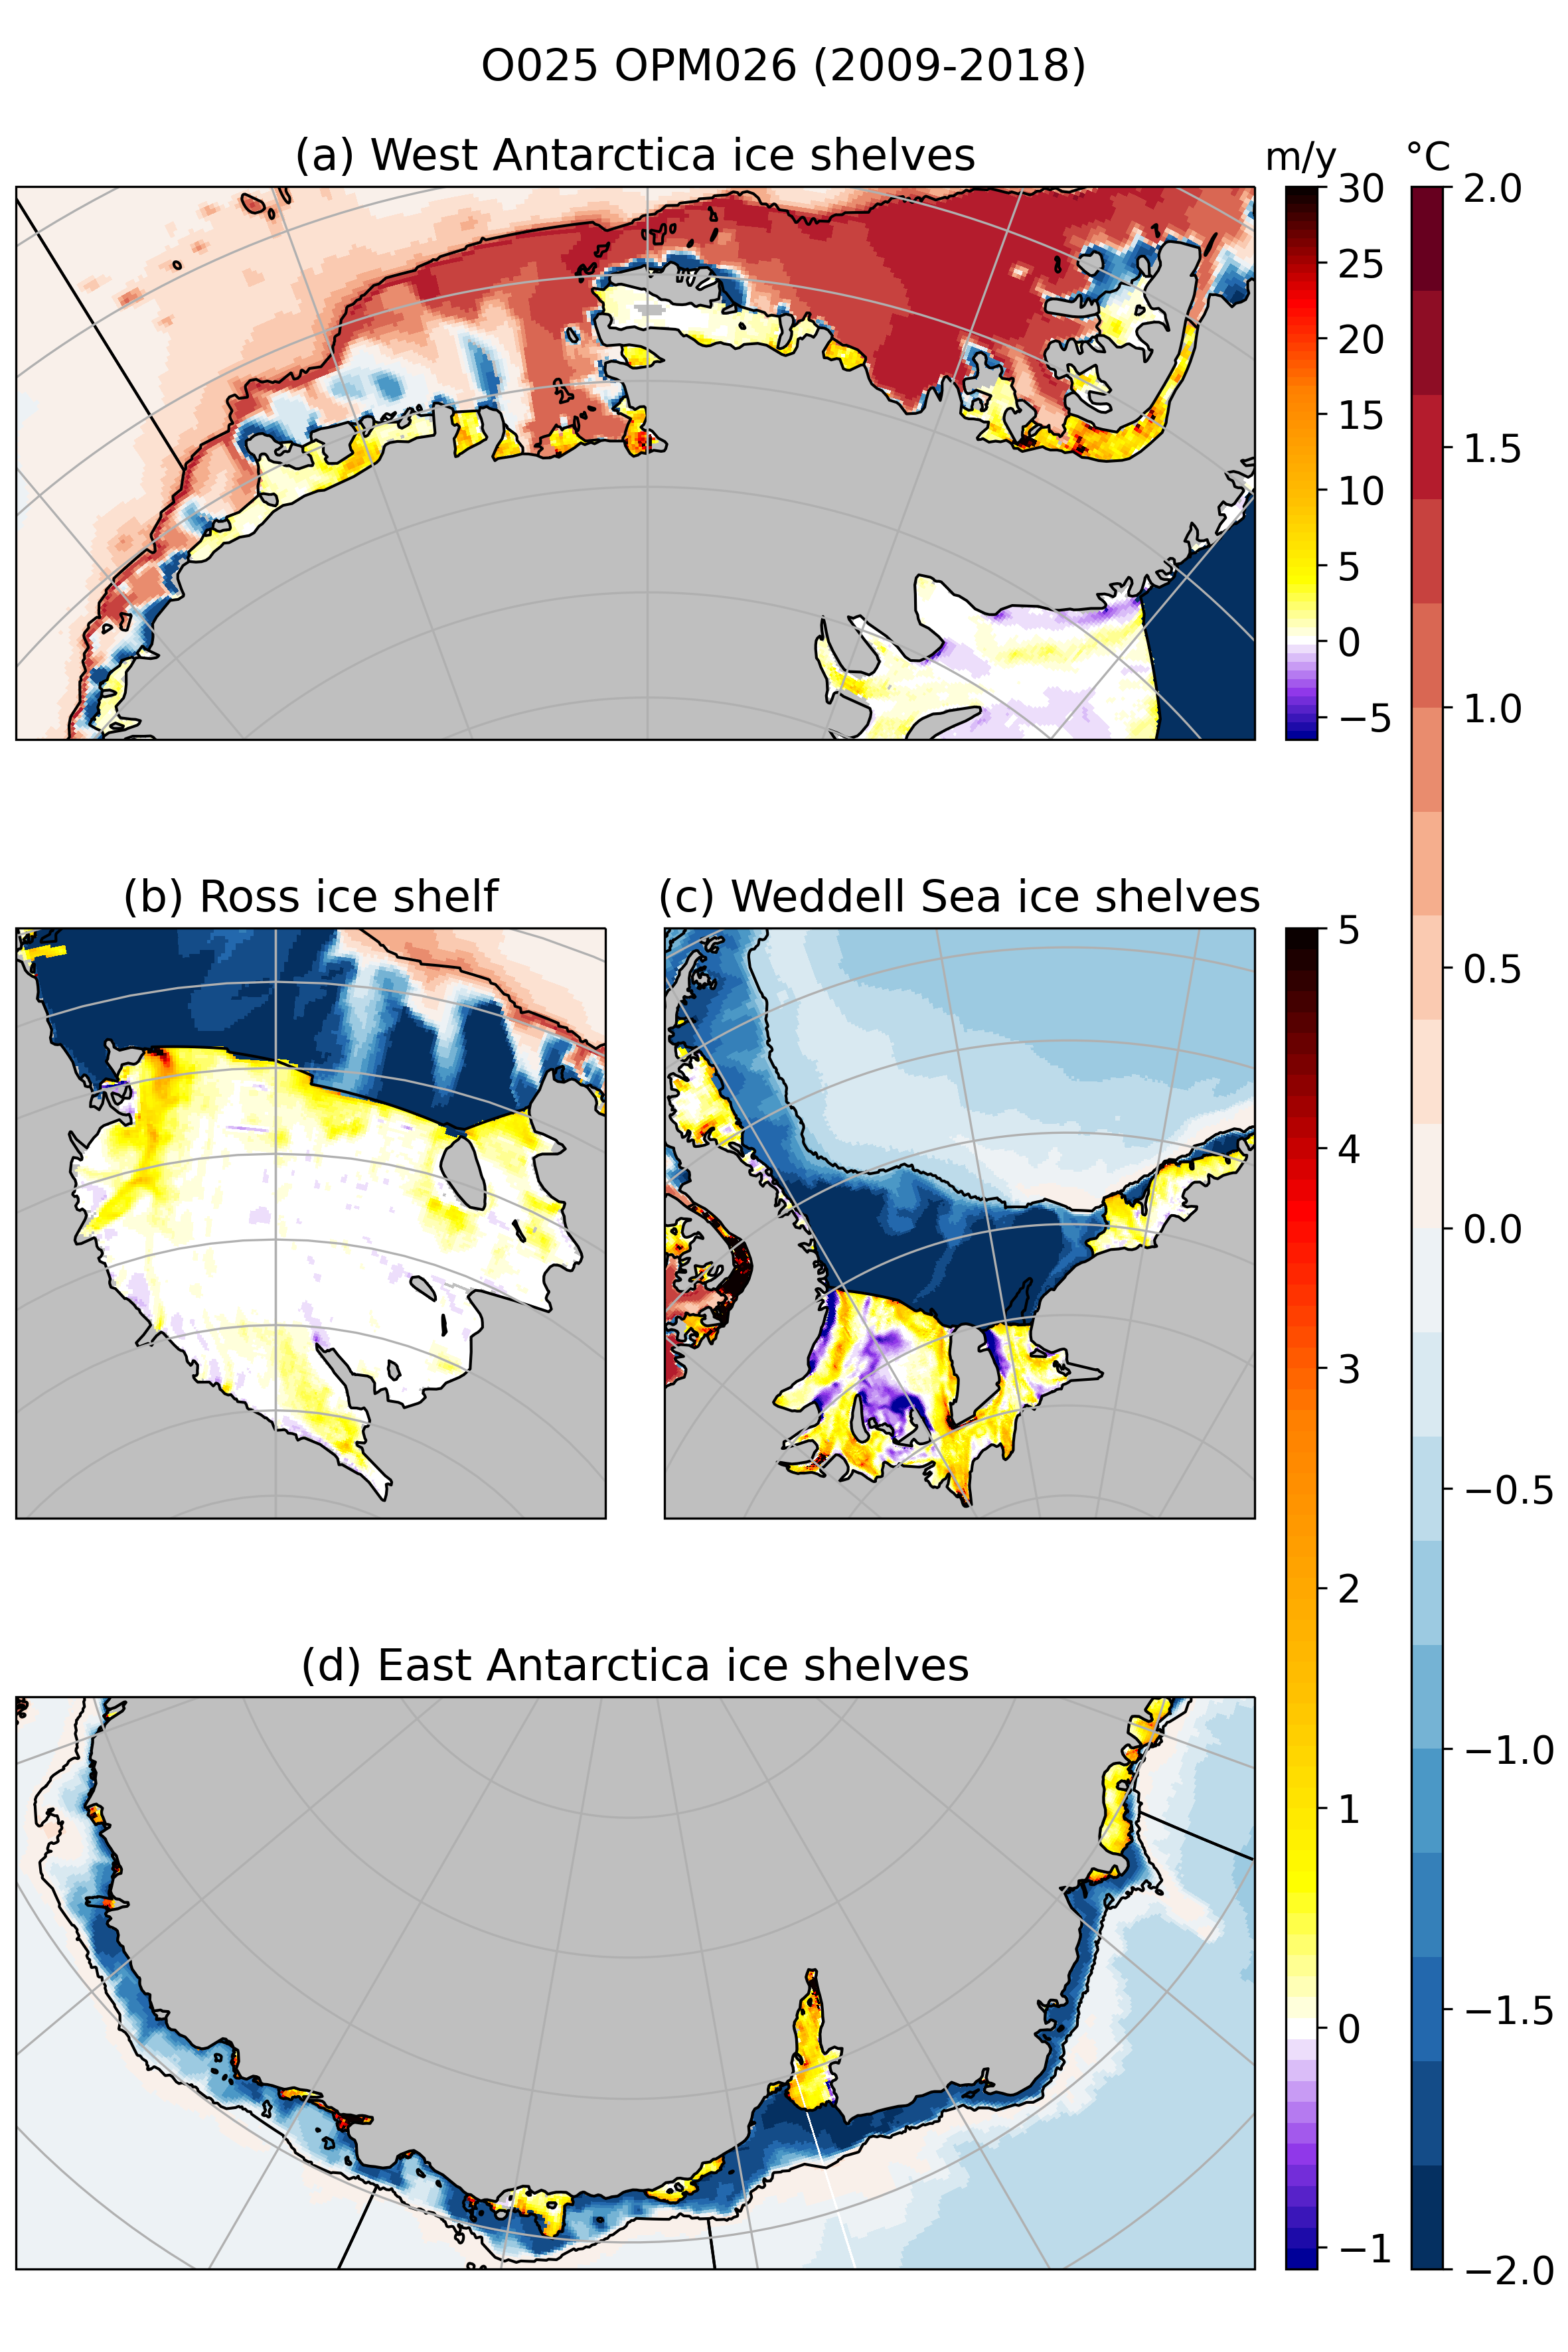
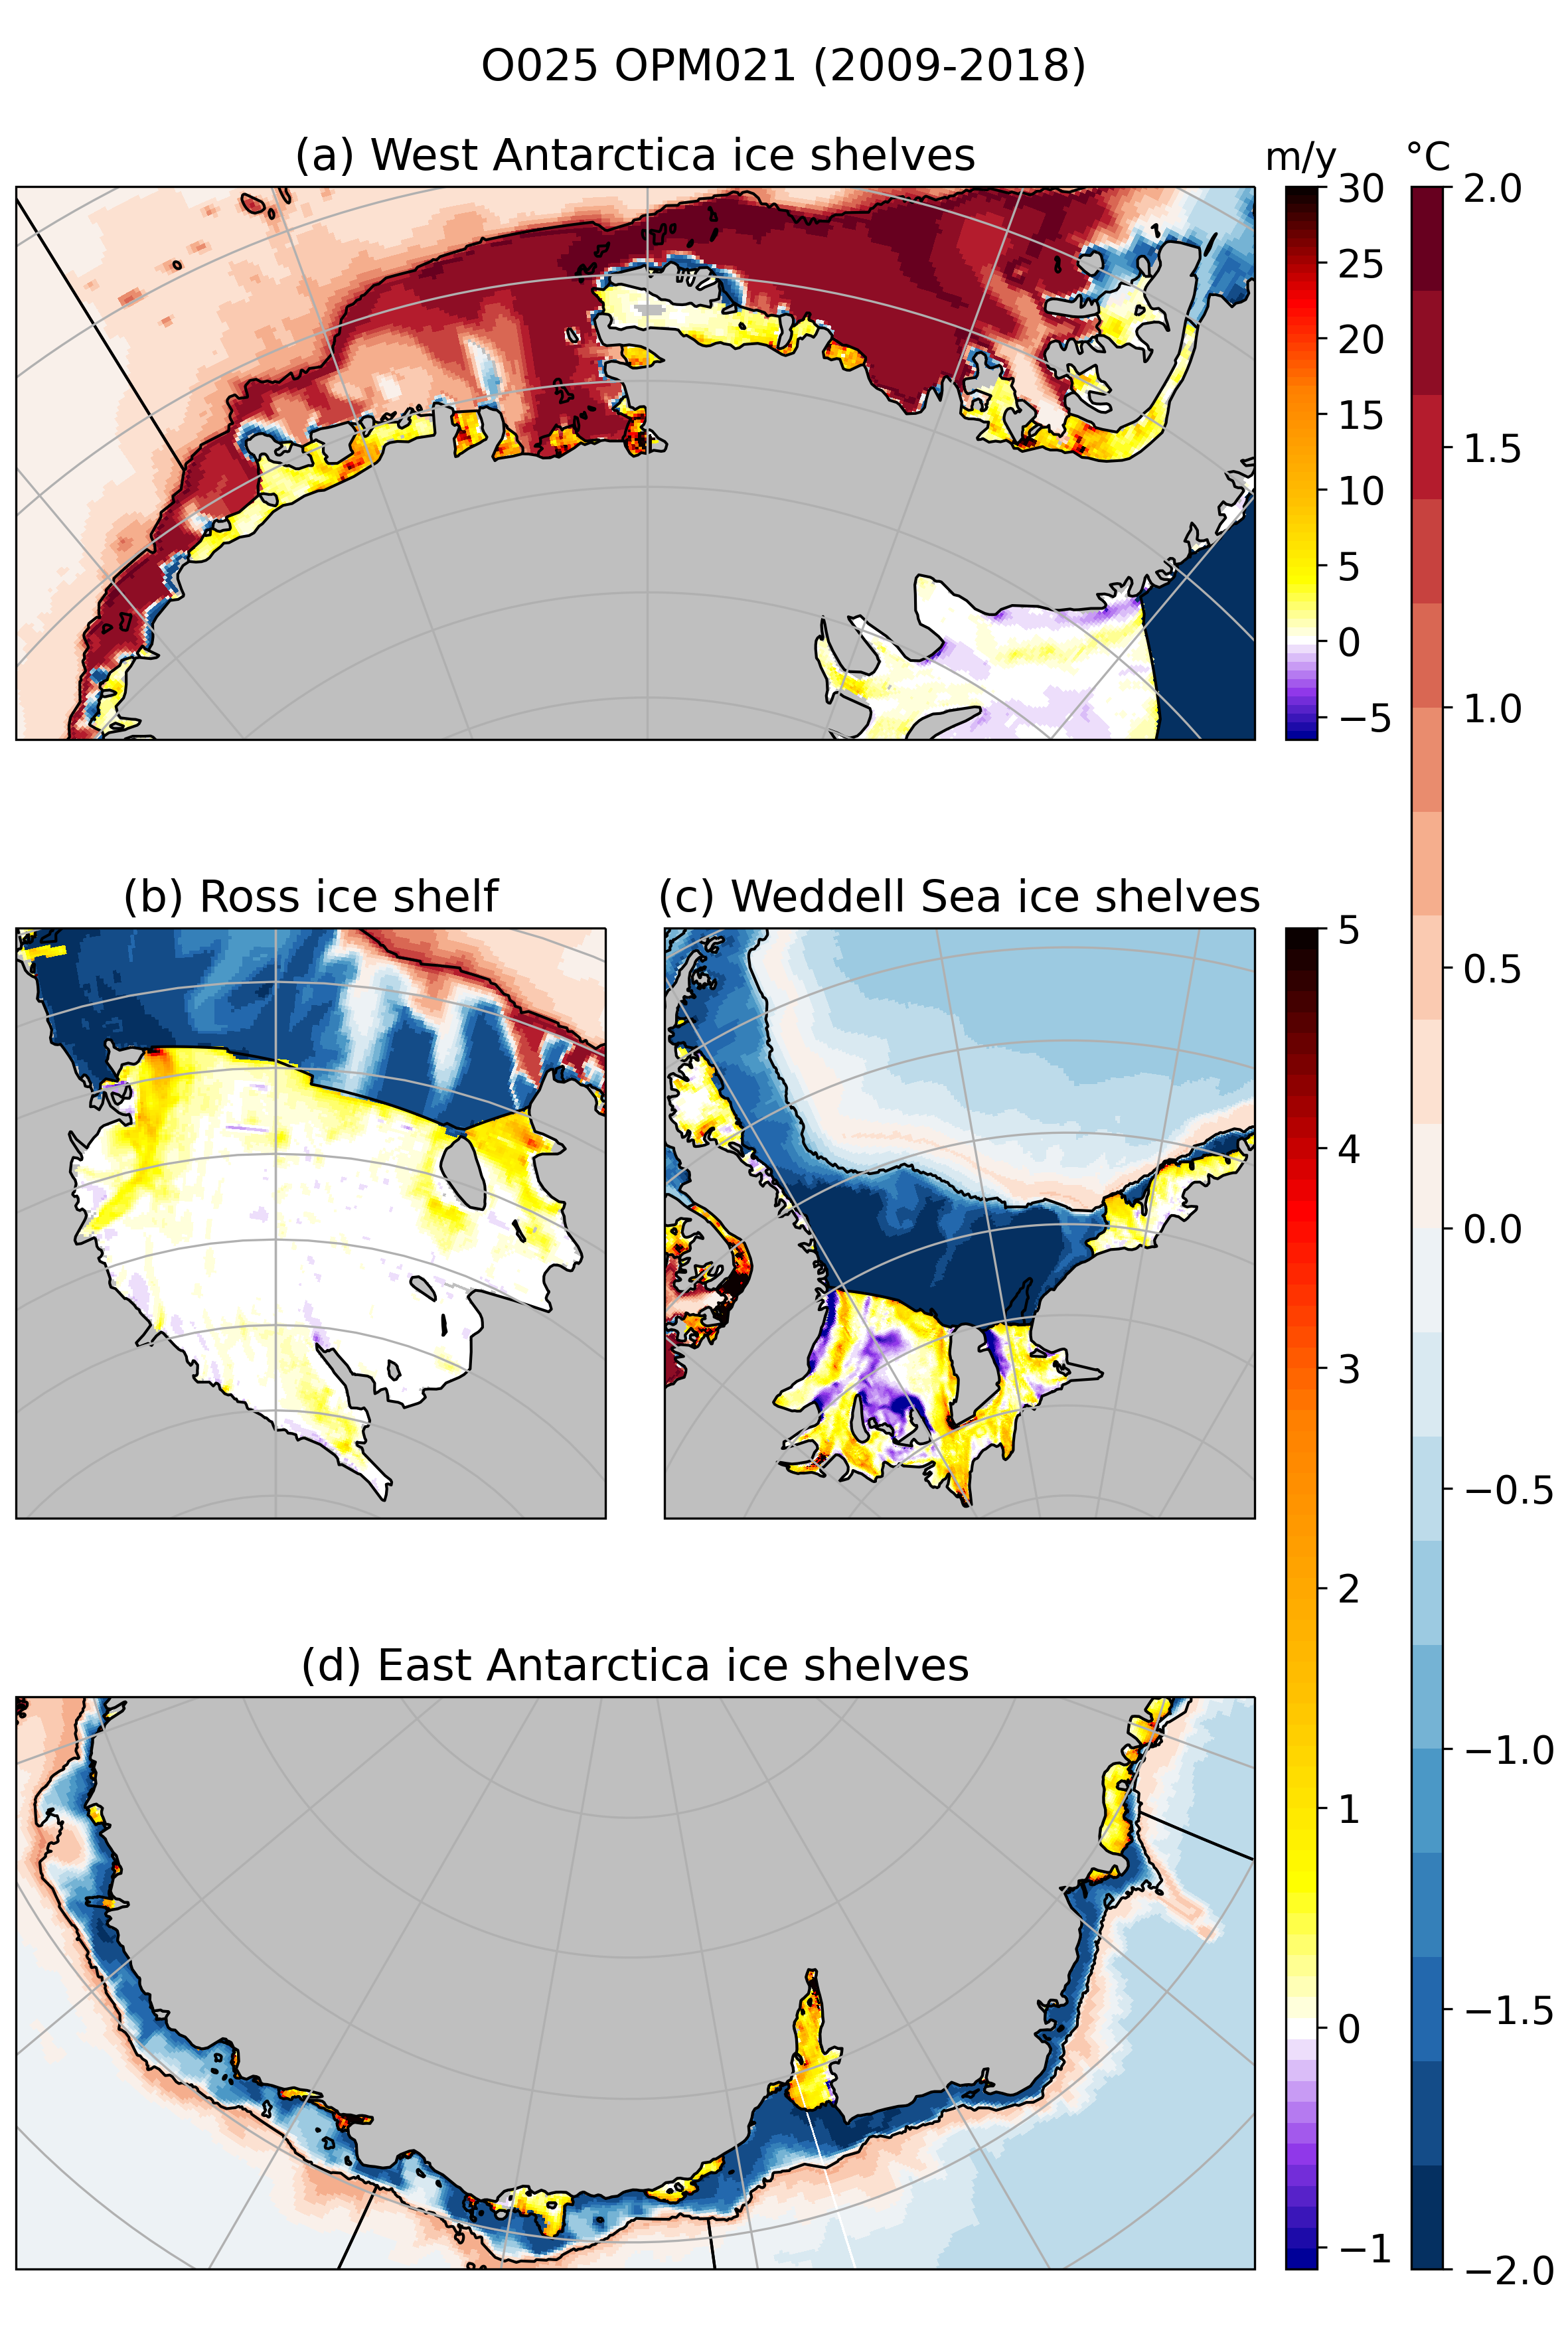
Map of ice shelf melt for both simulations OPM021 and OPM026 over the last decade of the simulations (2009-2018) with bottom temperature.
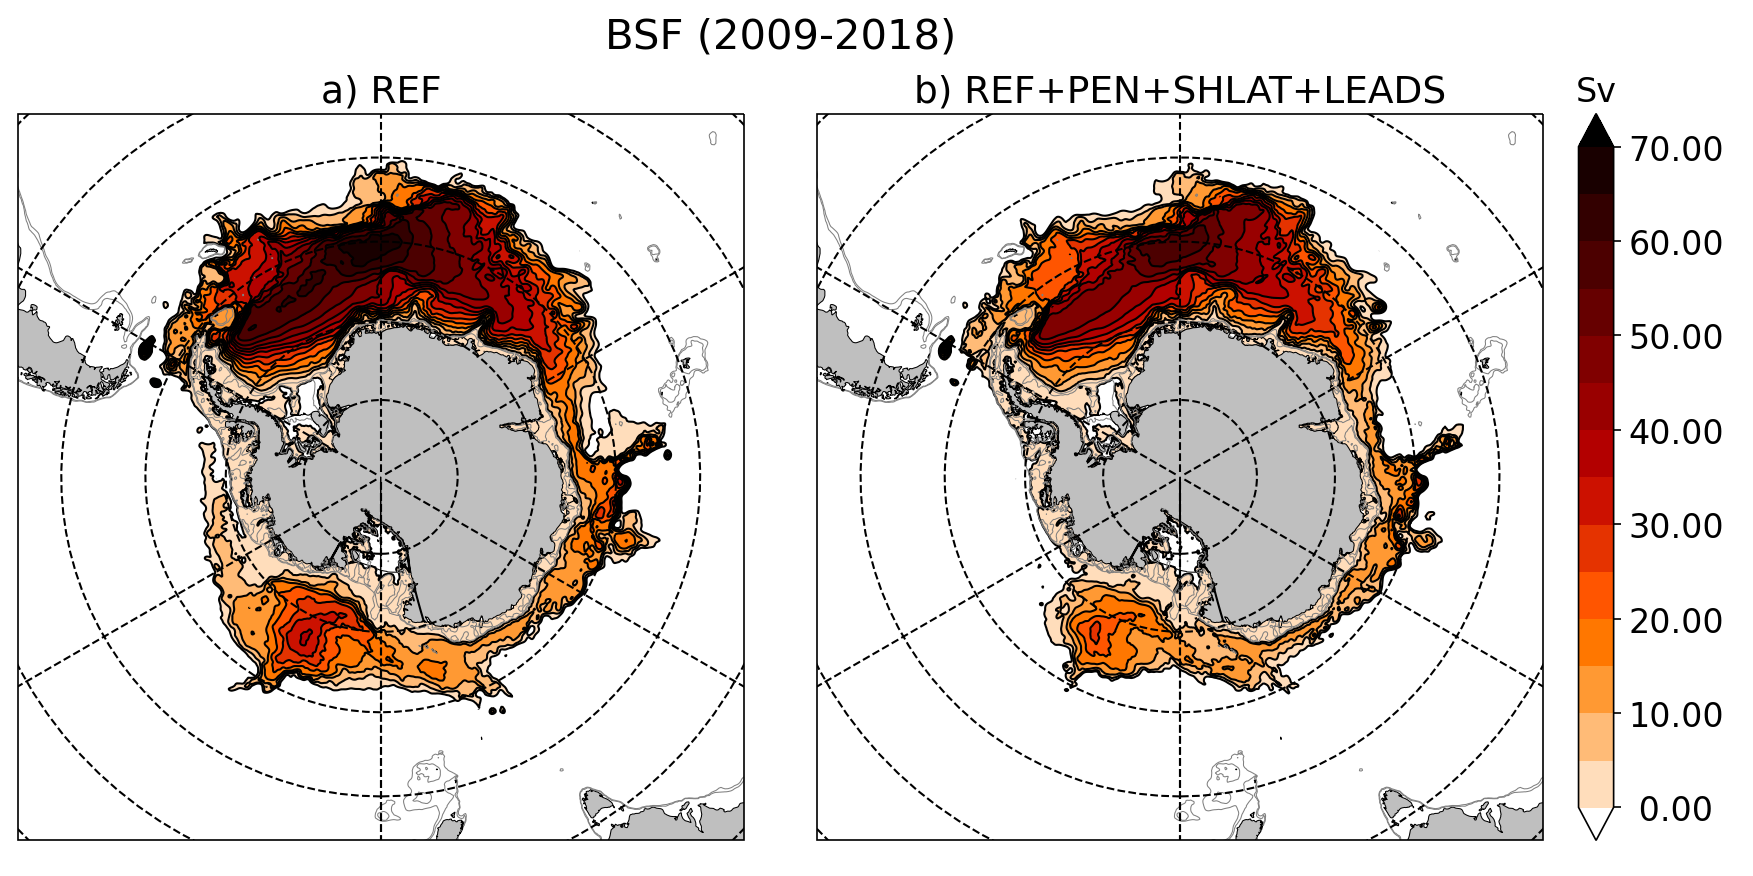
Map of barotropic stream function for both simulations OPM021 and OPM026 over climatology 2009-2018
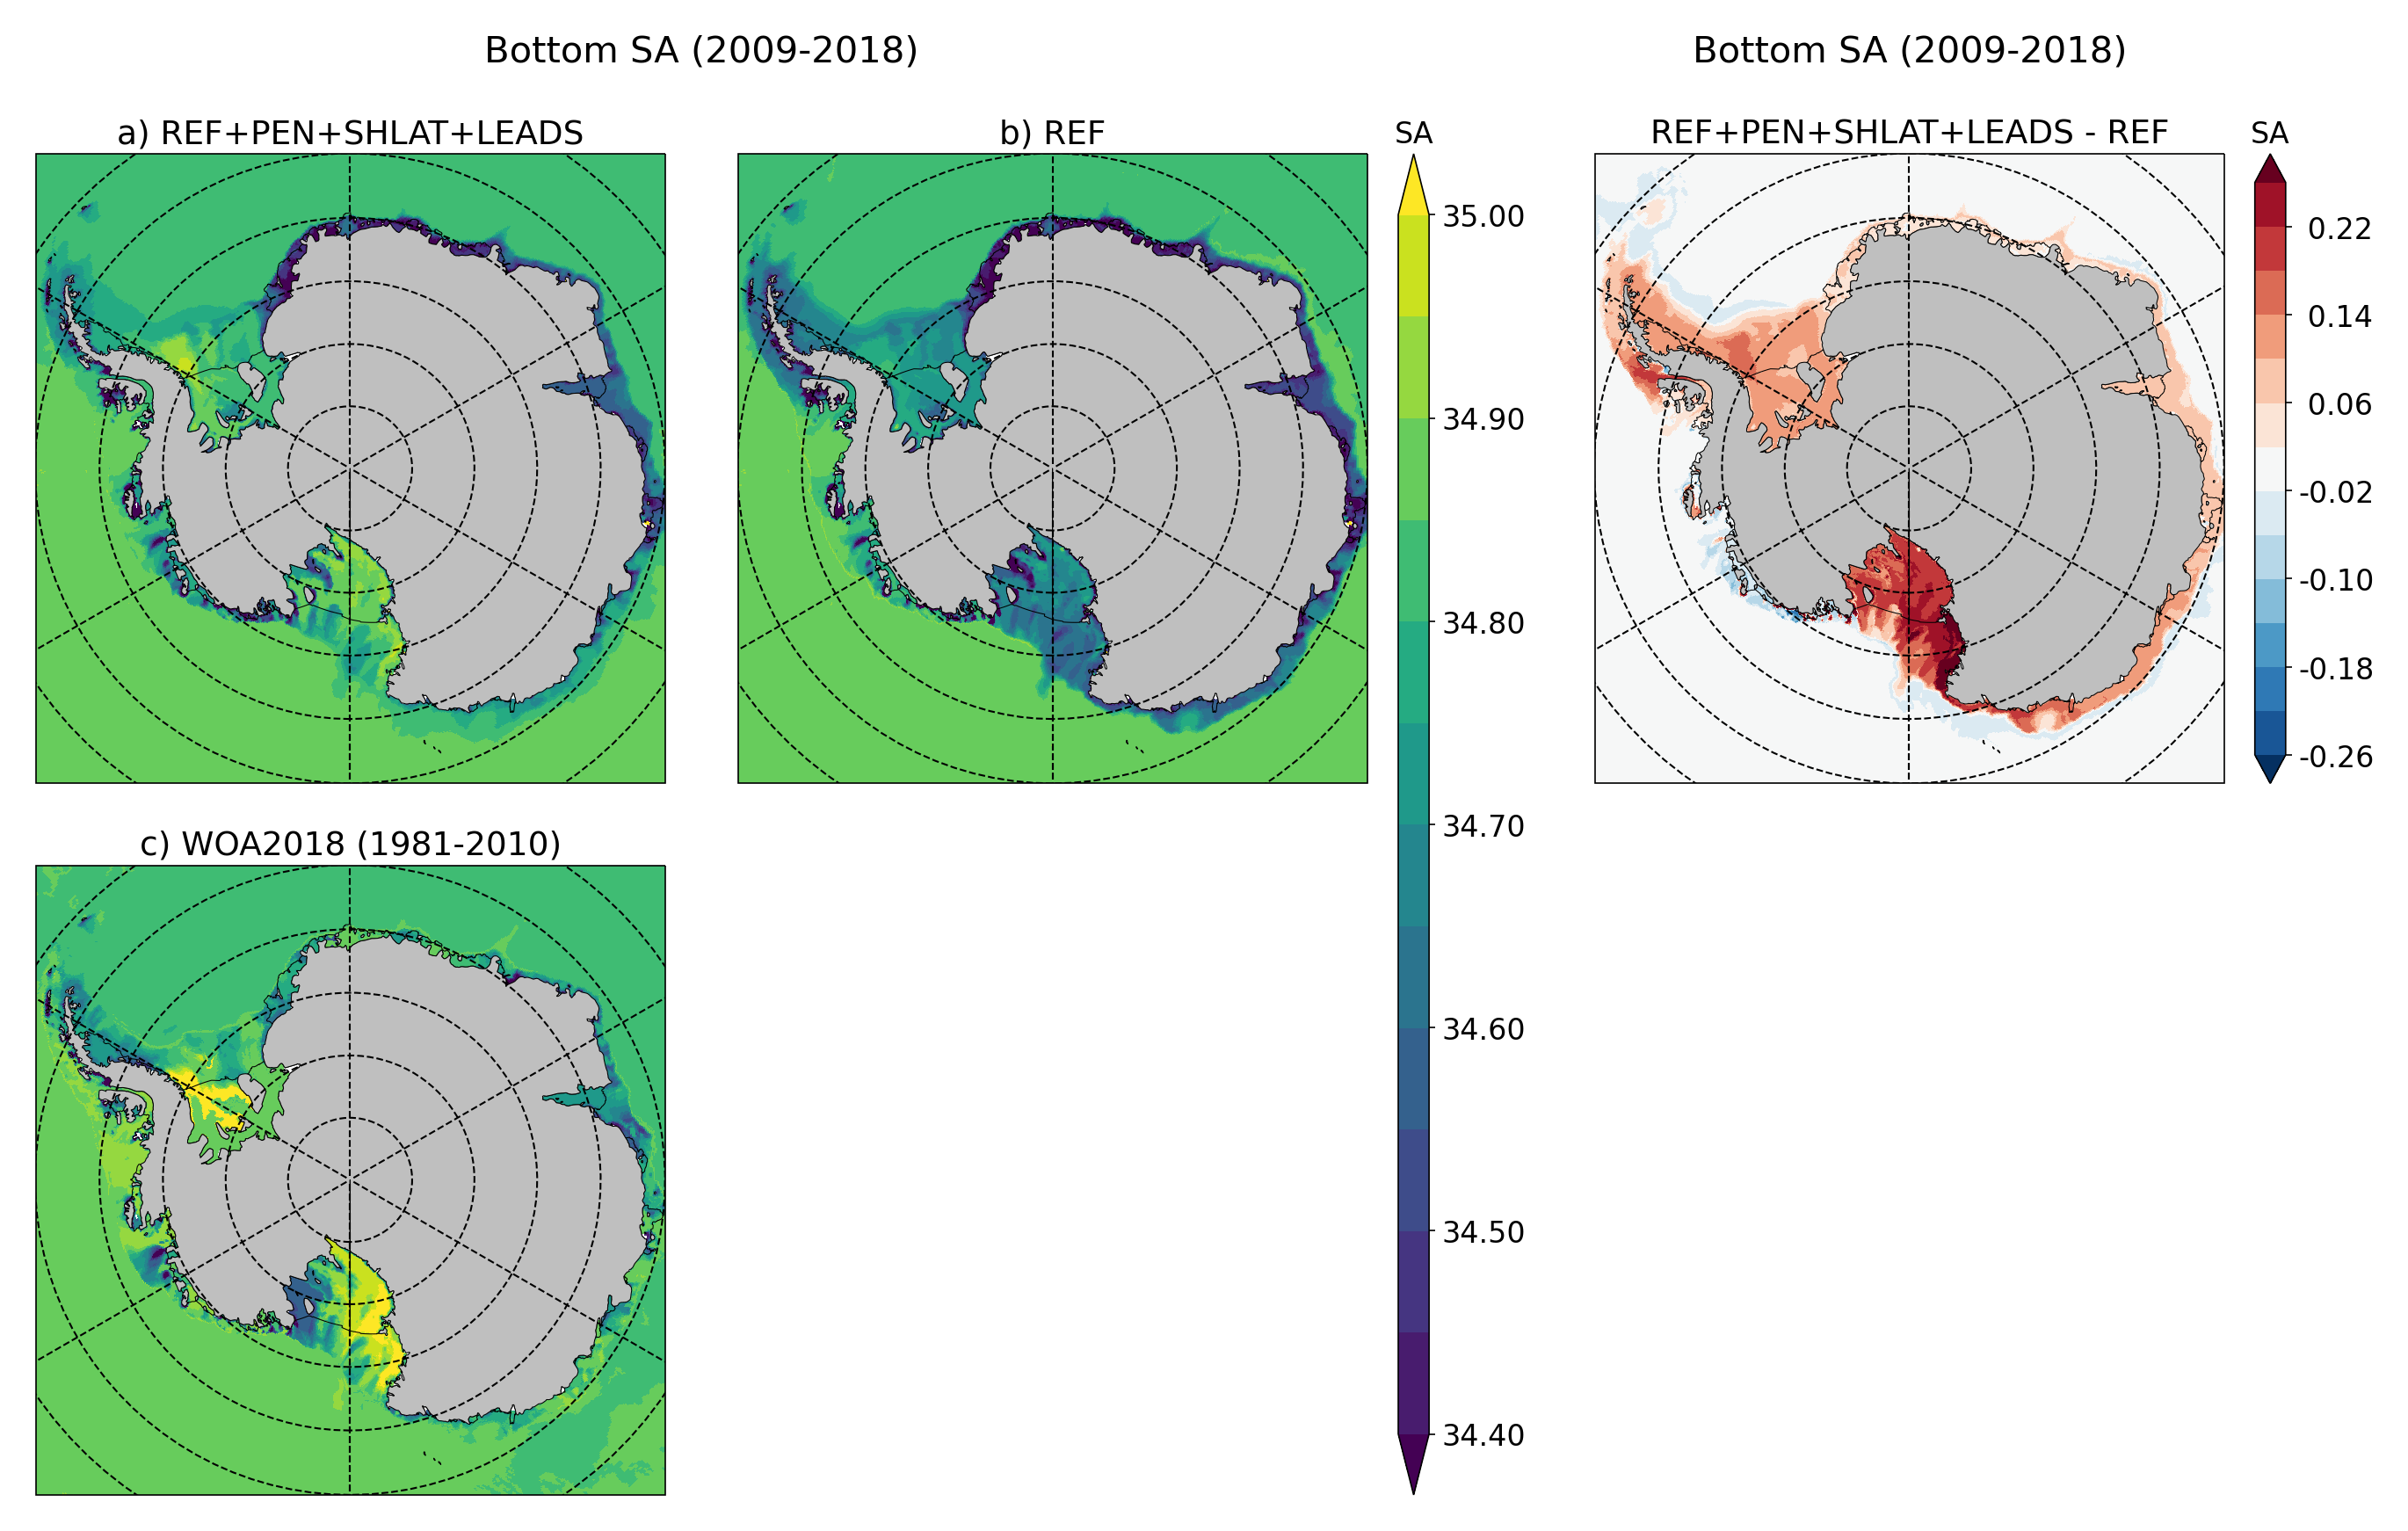
Map of bottomT and bottomS for both simulations OPM021 and OPM026 over the climatology 2009-2018