eORCA025.L121-OPM027
Summary
Compare to eORCA025.L121-OPM026, we perturbed the atmospheric forcing by adding the HADCM3 A1B monthly 2160-2200 anomaly (wrt XXXX) to all the forcing variables.
Input files
All the inputs files needed to run this configuration are here: https://ige-meom-opendap.univ-grenoble-alpes.fr/thredds/catalog/meomopendap/extract/eORCA025.L121/eORCA025.L121-OPM026/catalog.html?dataset=meomscanpublic/eORCA025.L121/eORCA025.L121-OPM026/eORCA025.L121-OPM026_input.tar
A detailed description of each file is given in eORCA025 input files
Pertubed forcing set on demand.
Namelist
Except the sbcblk namelist block, no change compare to eORCA025.L121-OPM026.
Full files are available here: https://github.com/pmathiot/NEMOCFG/tree/main/cfgs/eORCA025.L121-OPM026/cfgs/eORCA025.L121-OPM027/EXPREF
namelist_oce
change atmospheric forcing file name:
!-----------------------------------------------------------------------
&namsbc_blk    !   namsbc_blk  generic Bulk formula                     (ln_blk =T)
!-----------------------------------------------------------------------
   !                    !  bulk algorithm :
   ln_NCAR      = .true.    ! "NCAR"      algorithm   (Large and Yeager 2008)
   ln_COARE_3p0 = .false.   ! "COARE 3.0" algorithm   (Fairall et al. 2003)
   ln_COARE_3p5 = .false.   ! "COARE 3.5" algorithm   (Edson et al. 2013)
   ln_ECMWF     = .false.   ! "ECMWF"     algorithm   (IFS cycle 31)
      !
      rn_zqt      =  2.       !  Air temperature & humidity reference height (m)
      rn_zu       = 10.       !  Wind vector reference height (m)
      ln_Cd_L12   = .false.   !  air-ice drags = F(ice concentration) (Lupkes et al. 2012)
      ln_Cd_L15   = .false.   !  air-ice drags = F(ice concentration) (Lupkes et al. 2015)
      ln_taudif   = .false.   !  HF tau contribution: use "mean of stress module - module of the mean stress" data
      rn_pfac     = 1.        !  multiplicative factor for precipitation (total & snow)
      rn_efac     = 1.        !  multiplicative factor for evaporation (0. or 1.)
      rn_vfac     = 0.        !  multiplicative factor for ocean & ice velocity used to
      !                       !  calculate the wind stress (0.=absolute or 1.=relative winds)
   cn_dir = './'
   !_______!__________________!___________________!___________!_____________!_________!___________!______________________________!__________!______!
   !       !  file name       ! frequency (hours) ! variable  ! time interp.!  clim   ! 'yearly'/ ! weights filename             ! rotation !  lsm !
   !       !                  !  (if <0  months)  !   name    !   (logical) !  (T/F)  ! 'monthly' !                              !  paring  !      !
   !_______!__________________!___________________!___________!_____________!_________!___________!______________________________!__________!______!
   sn_wndi = 'drowned_uas_JRA55_perturbed_A1B_HadCM3_21602200-19792019_anomaly'    ,  3.  ,  'uas'    ,    .true.   , .false. , 'yearly'  , 'eORCA025_JRA55_do_c3.0_weights_bicubic.nc' , 'U1' ,   ''
   sn_wndj = 'drowned_vas_JRA55_perturbed_A1B_HadCM3_21602200-19792019_anomaly'    ,  3.  ,  'vas'    ,    .true.   , .false. , 'yearly'  , 'eORCA025_JRA55_do_c3.0_weights_bicubic.nc' , 'V1' ,   ''
   sn_qsr  = 'drowned_rsds_JRA55_perturbed_A1B_HadCM3_21602200-19792019_anomaly'   ,  3.  ,  'rsds'   ,    .true.   , .false. , 'yearly'  , 'eORCA025_JRA55_do_c3.0_weights_bilin.nc' , ''   ,   ''
   sn_qlw  = 'drowned_rlds_JRA55_perturbed_A1B_HadCM3_21602200-19792019_anomaly'   ,  3.  ,  'rlds'   ,    .true.   , .false. , 'yearly'  , 'eORCA025_JRA55_do_c3.0_weights_bilin.nc' , ''   ,   ''
   sn_tair = 'drowned_tas_JRA55_perturbed_A1B_HadCM3_21602200-19792019_anomaly'    ,  3.  ,  'tas'    ,    .true.   , .false. , 'yearly'  , 'eORCA025_JRA55_do_c3.0_weights_bilin.nc' , ''   ,   ''
   sn_humi = 'drowned_huss_JRA55_perturbed_A1B_HadCM3_21602200-19792019_anomaly'   ,  3.  ,  'huss'   ,    .true.   , .false. , 'yearly'  , 'eORCA025_JRA55_do_c3.0_weights_bilin.nc' , ''   ,   ''
   sn_prec = 'drowned_tprecip_JRA55_perturbed_A1B_HadCM3_21602200-19792019_anomaly',  3.  ,  'tprecip',    .true.   , .false. , 'yearly'  , 'eORCA025_JRA55_do_c3.0_weights_bilin.nc' , ''   ,   ''
   sn_snow = 'drowned_prsn_JRA55_perturbed_A1B_HadCM3_21602200-19792019_anomaly'   ,  3.  ,  'prsn'   ,    .true.   , .false. , 'yearly'  , 'eORCA025_JRA55_do_c3.0_weights_bilin.nc' , ''   ,   ''
   sn_slp  = 'drowned_psl_JRA55_perturbed_A1B_HadCM3_21602200-19792019_anomaly'    ,  3.  ,  'psl'    ,    .true.   , .false. , 'yearly'  , 'eORCA025_JRA55_do_c3.0_weights_bilin.nc' , ''   ,   ''
   sn_cc   = 'NOT USED'             , 24.         ,  'CC'     ,   .false.   , .false. , 'yearly'  , ''                                        , ''   ,   ''
   sn_tdif = 'NOT USED'             , 24.         , 'taudif'  ,   .false.   , .true.  , 'yearly'  , 'eORCA025_JRA55_do_c3.0_weights_bilin.nc' , ''   ,   ''
/
Input files
Except the atmospheric forcings, no change in the input files.
Code changes
No changes wrt OPM026.
Full files are available here: https://github.com/pmathiot/NEMOCFG/tree/main/cfgs/eORCA025.L121-OPM027/src/
Monitoring
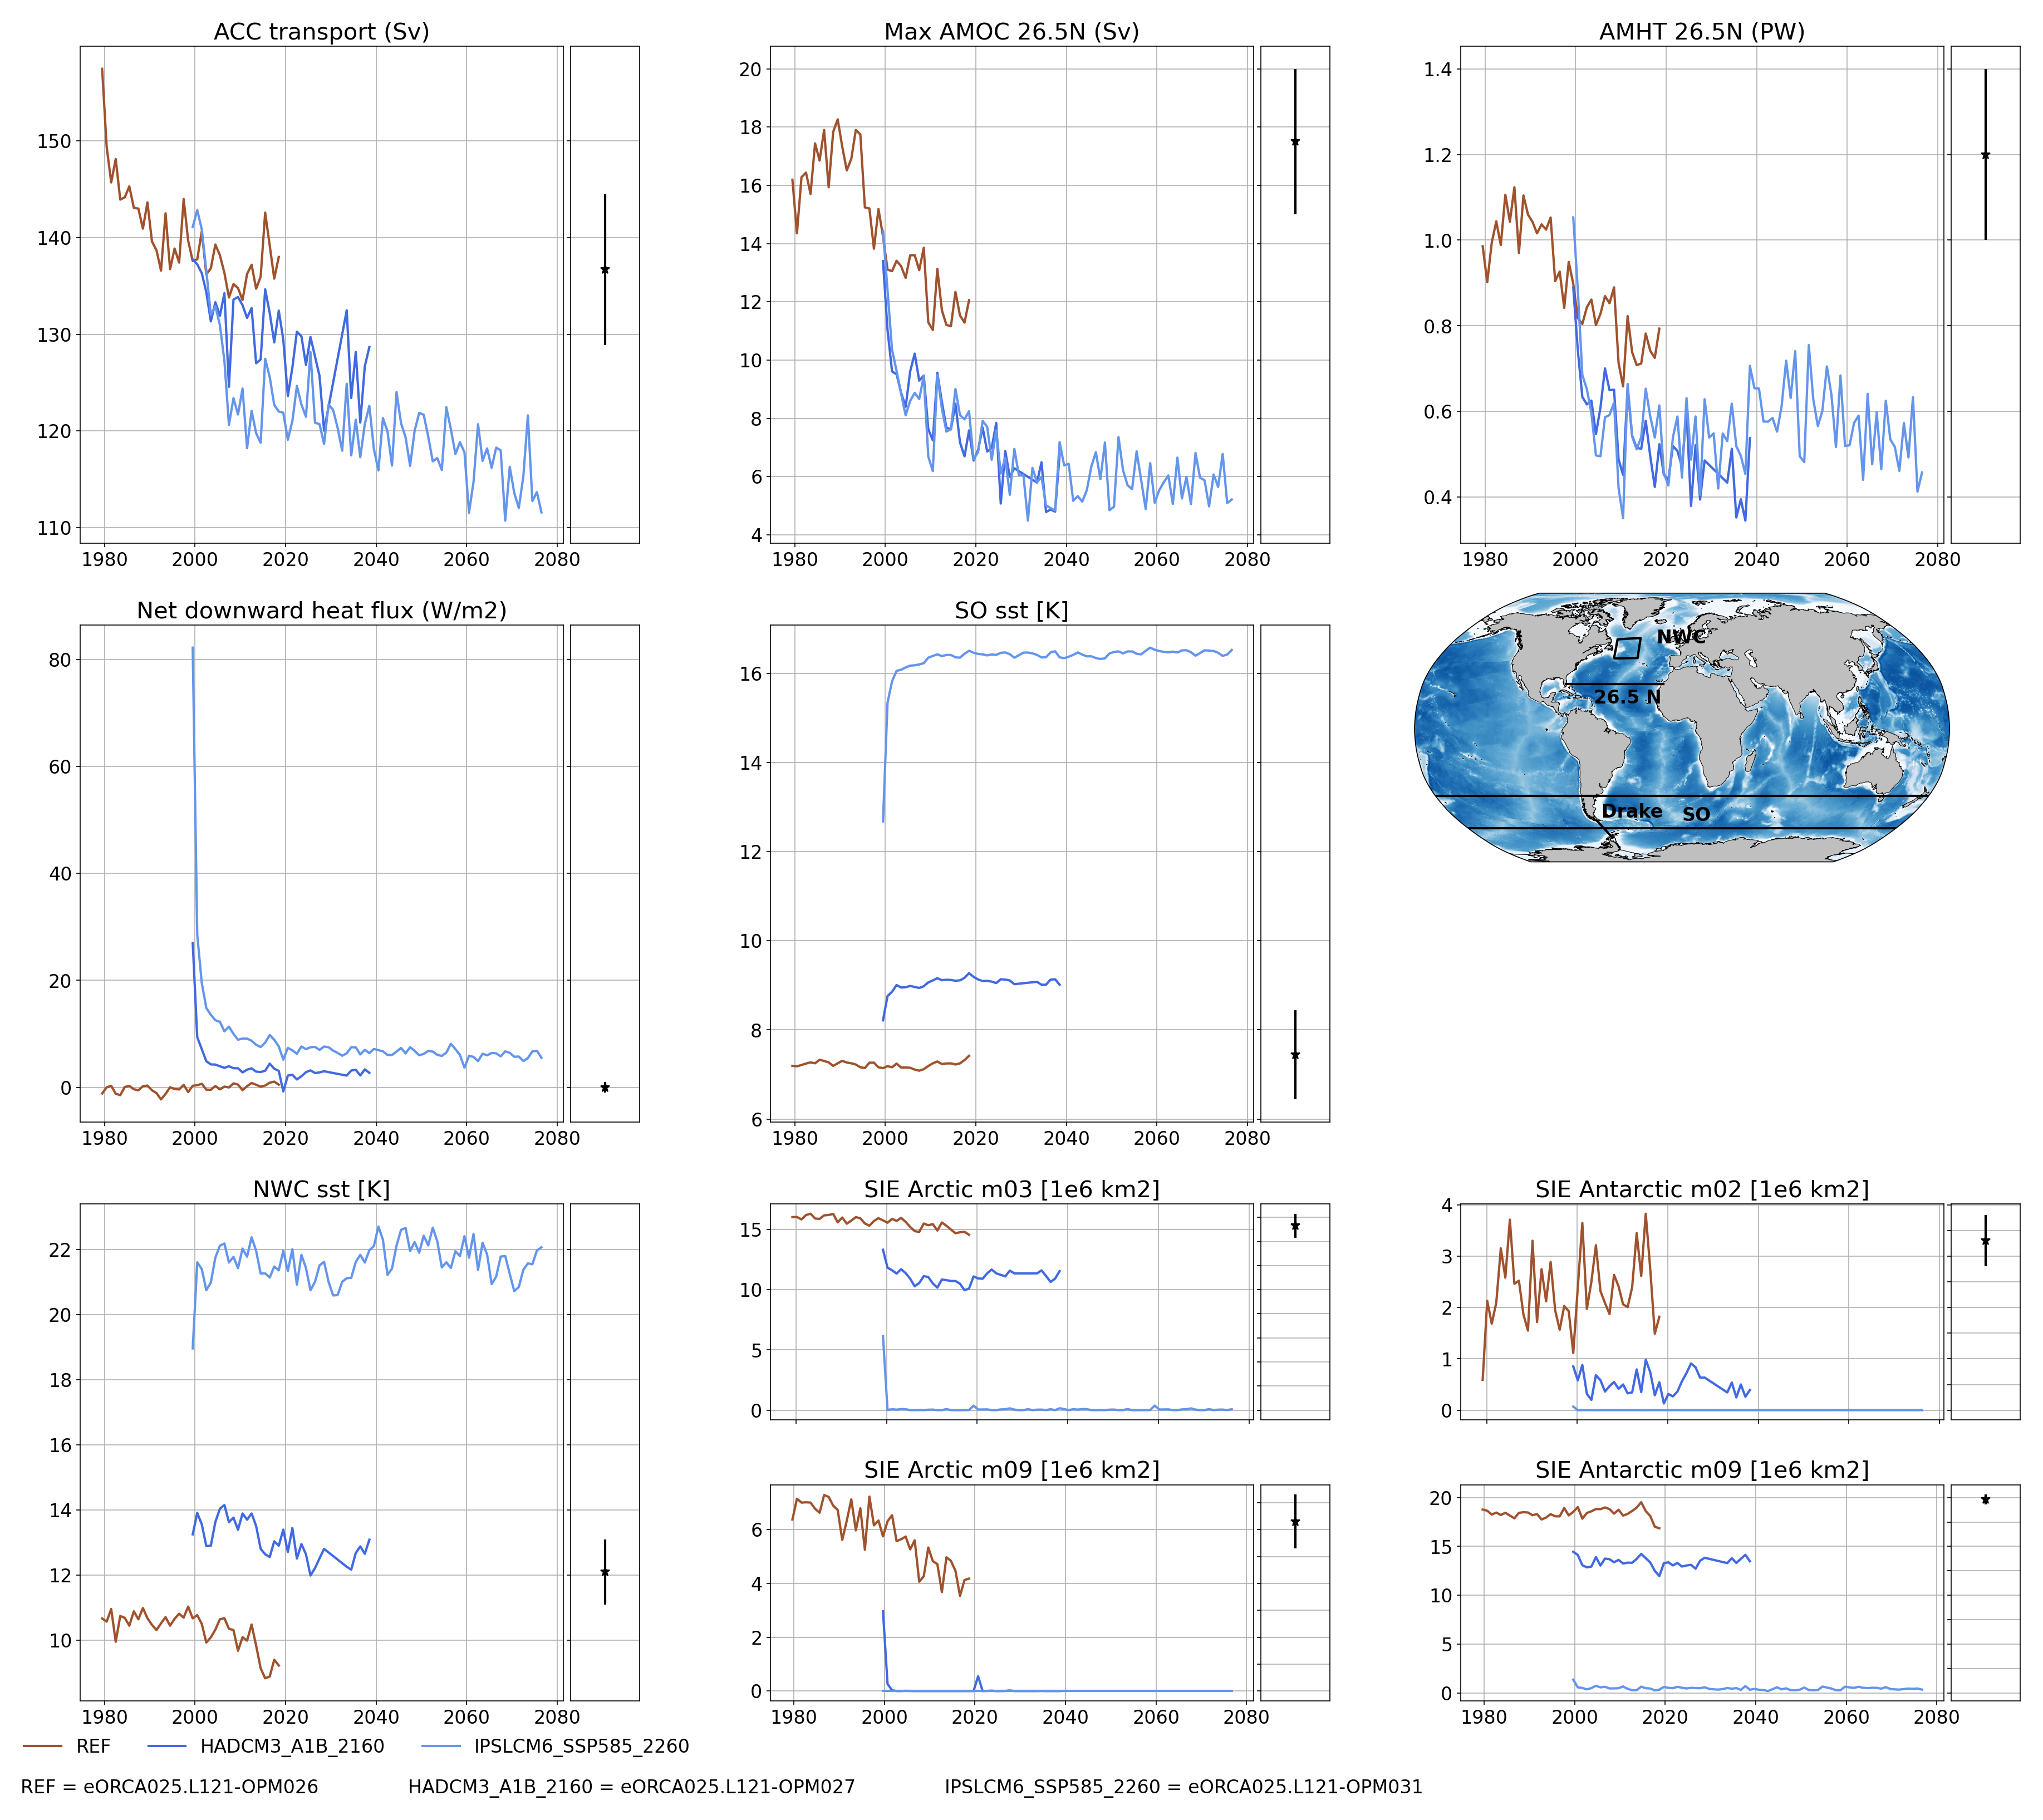
Global indicators
On these plot you can find a time series of:
ACC transport
AMOC at rapid array
AMHT at rapid array
Net global heat fluxes
mean sst in the southern ocean (see box in the map)
mean sst in the North West Corner (see box in the map)
sea ice extent (arctic/ant in summer/winter)
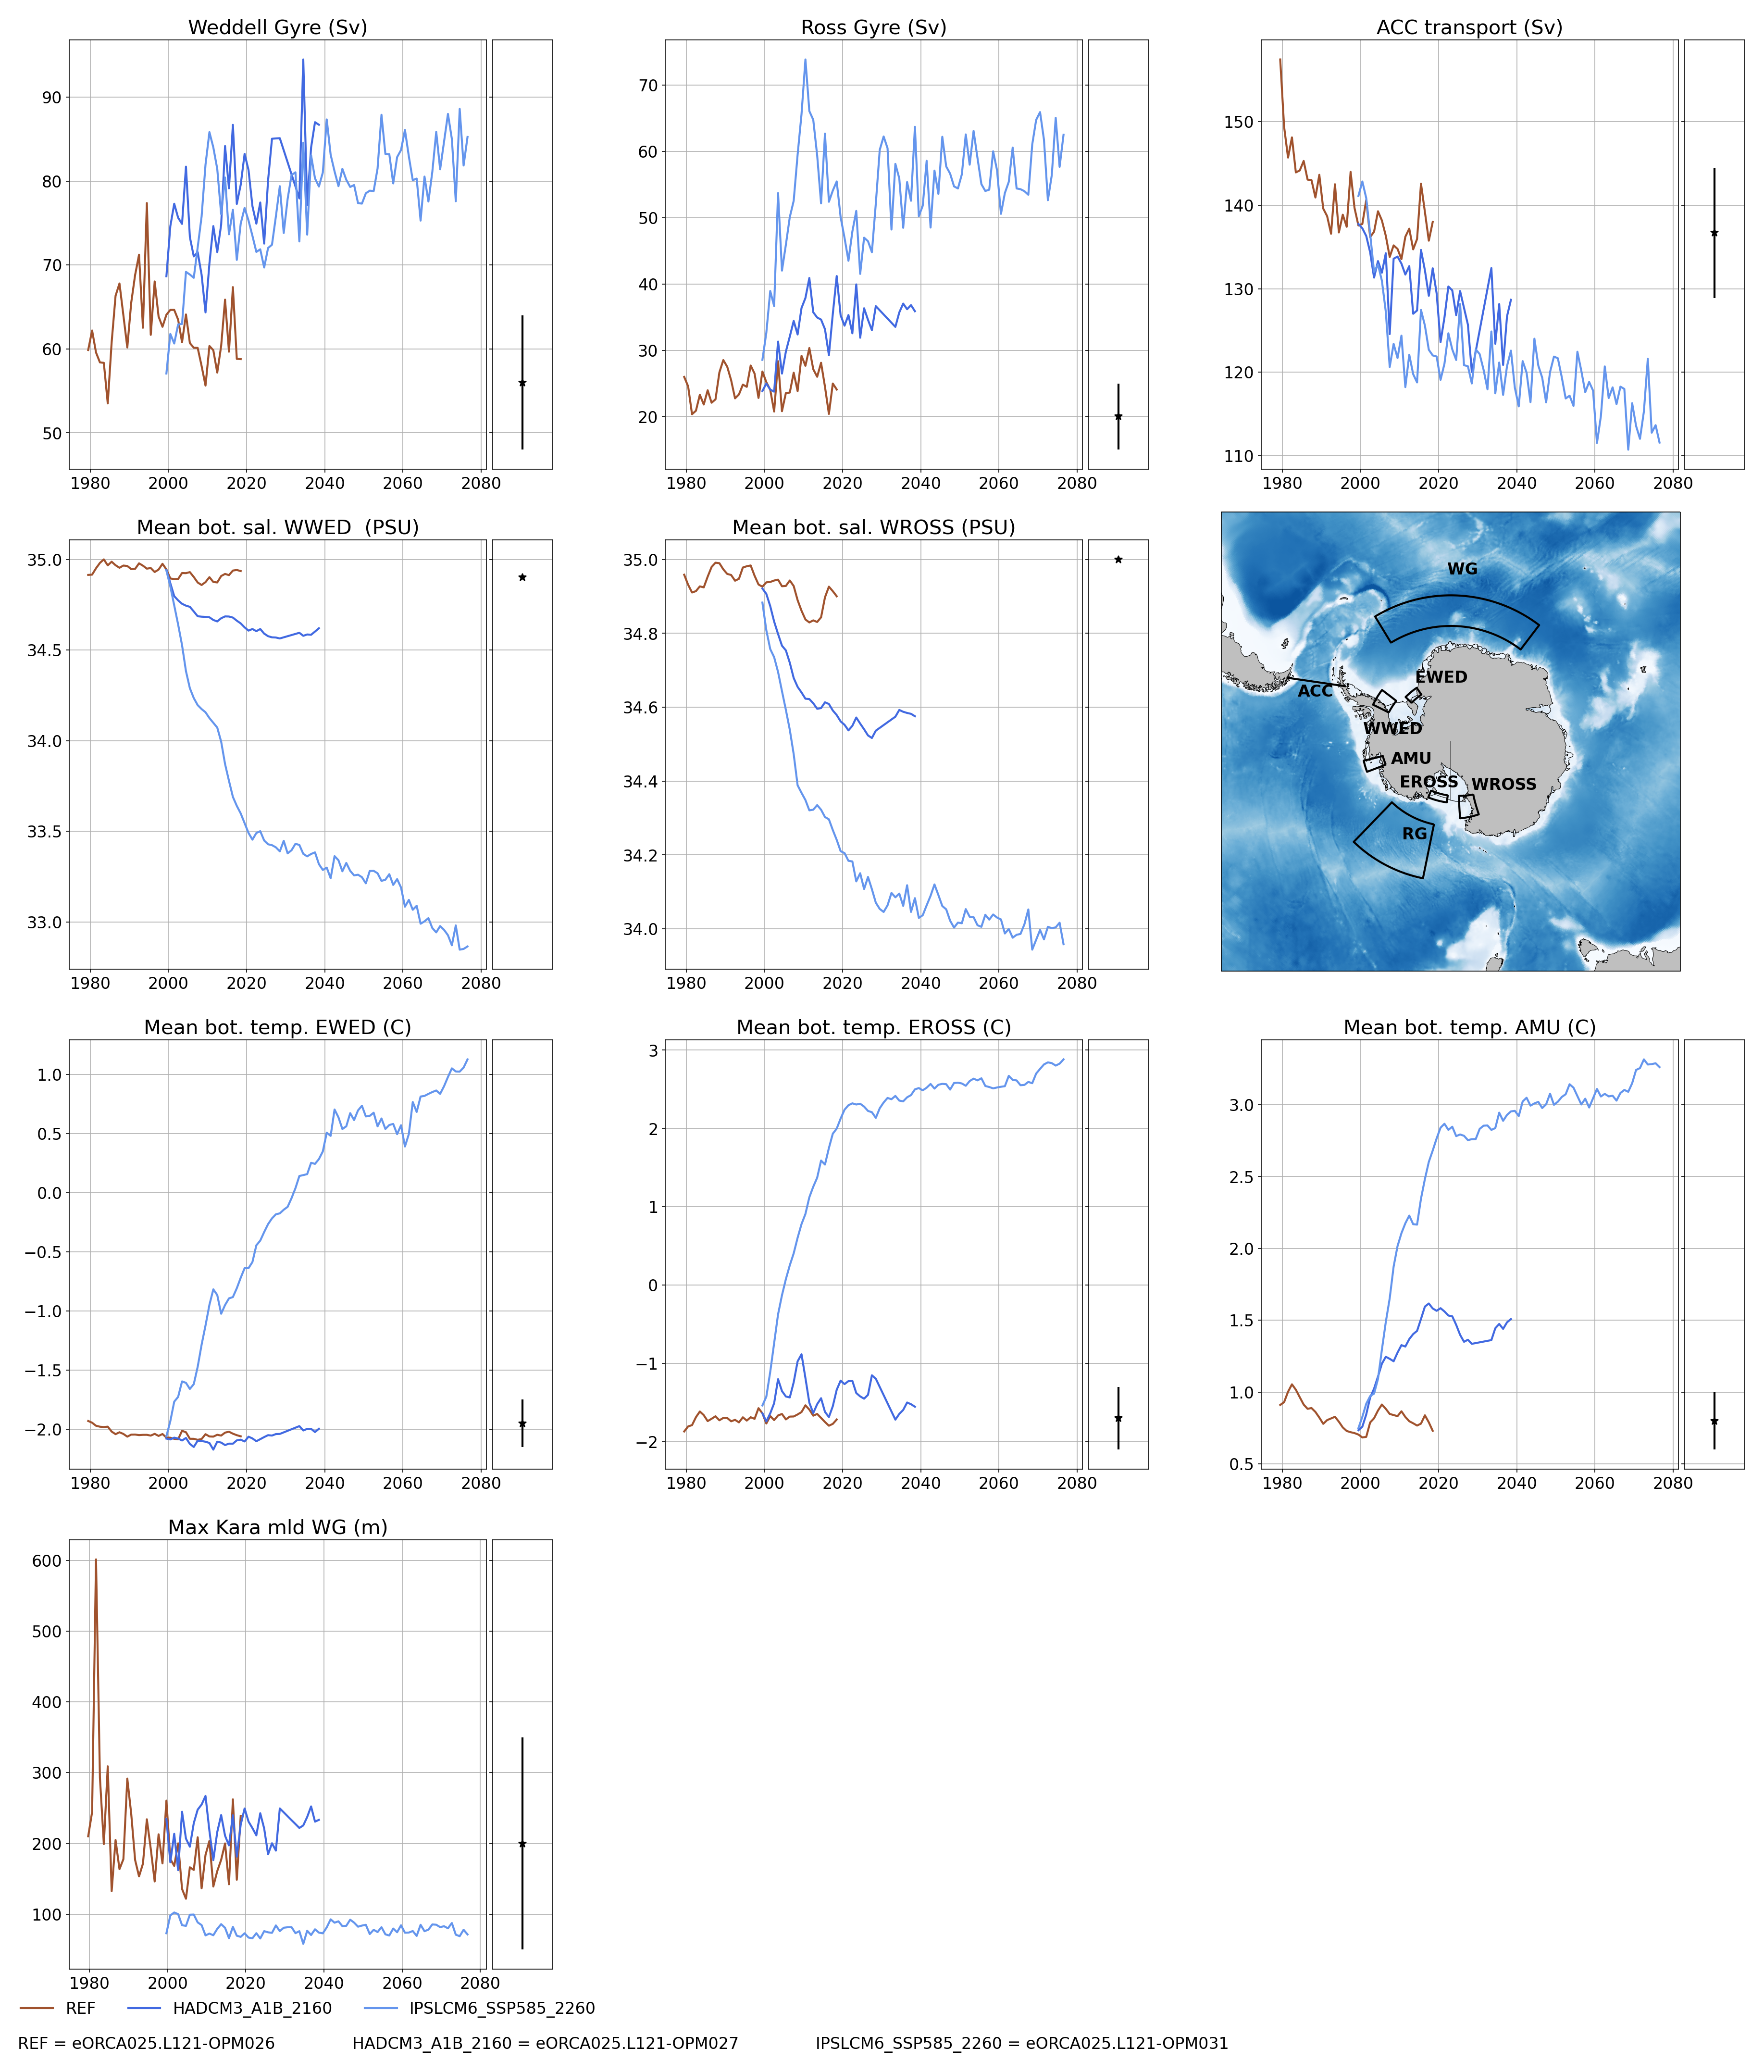
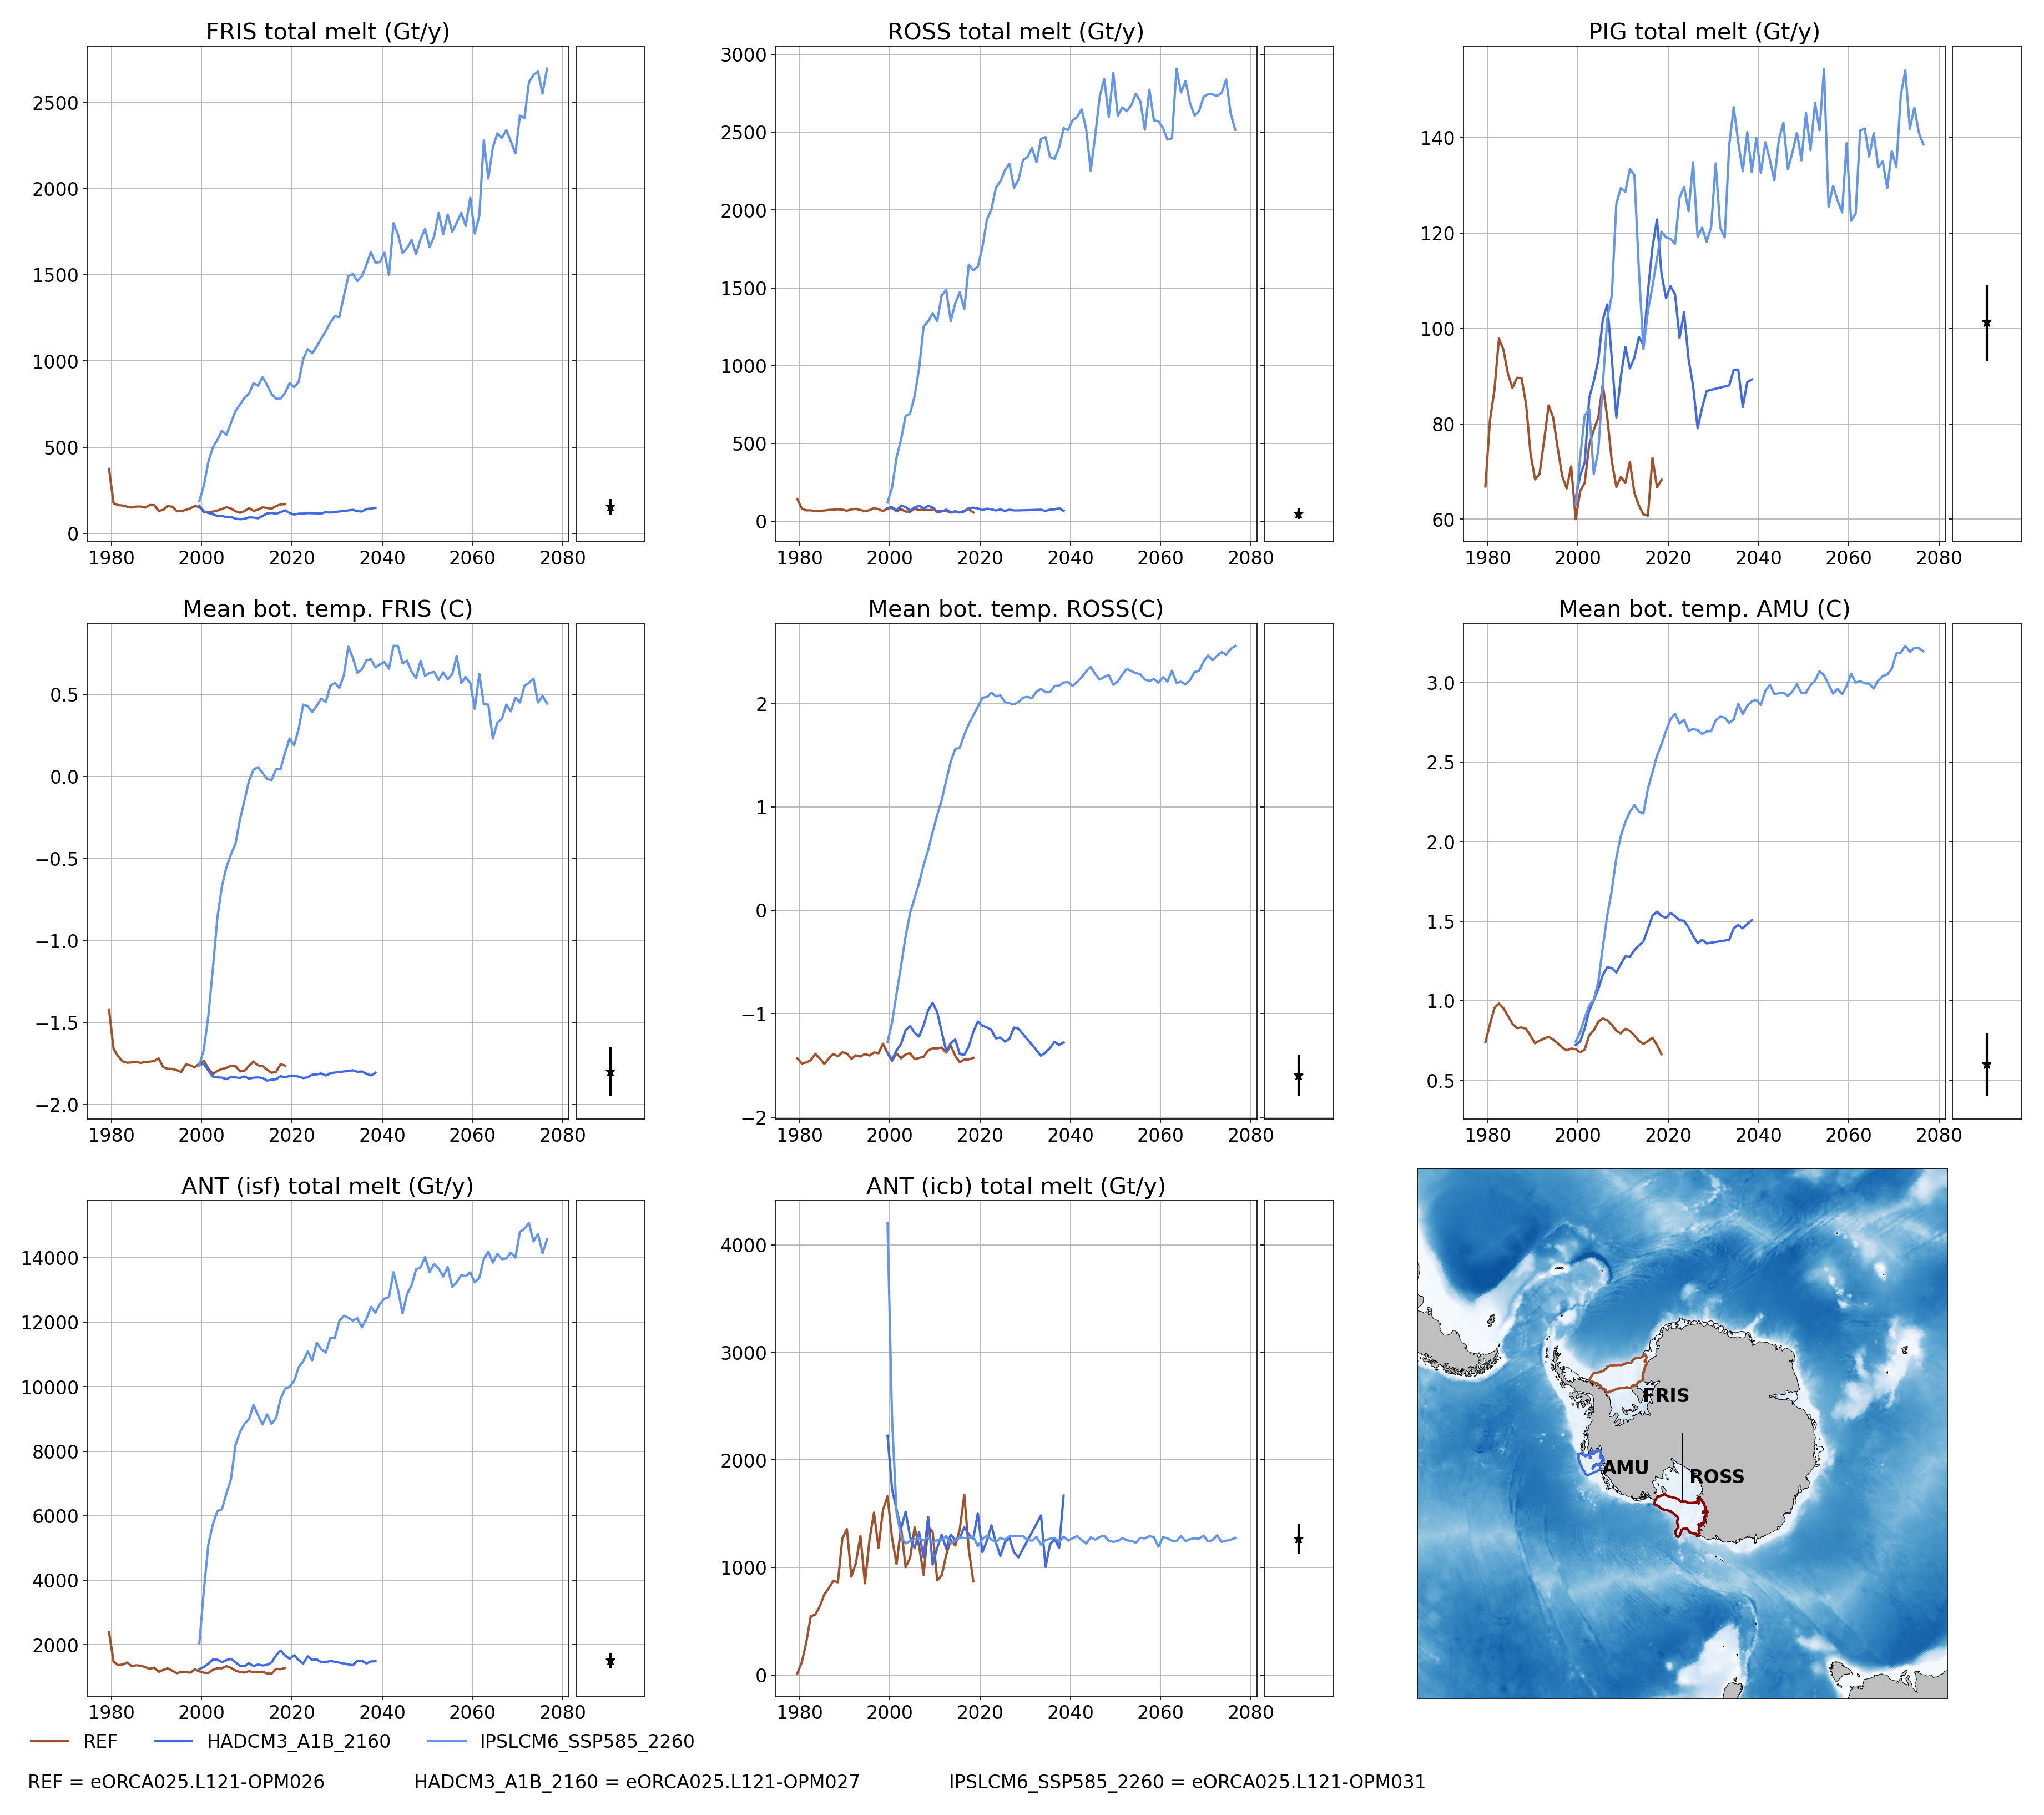
Regional indicators
On these plot, you can find time series of:
ACC transport
Maximum of the Weddell and Ross Gyre (box where the max compute show in the map)
Mean bottom salinity over the main dense water formation hot spot (West Ross and West FRIS)
Mean bottom temperature over East Ross and Amudsen sea to monitor CDW intrusion
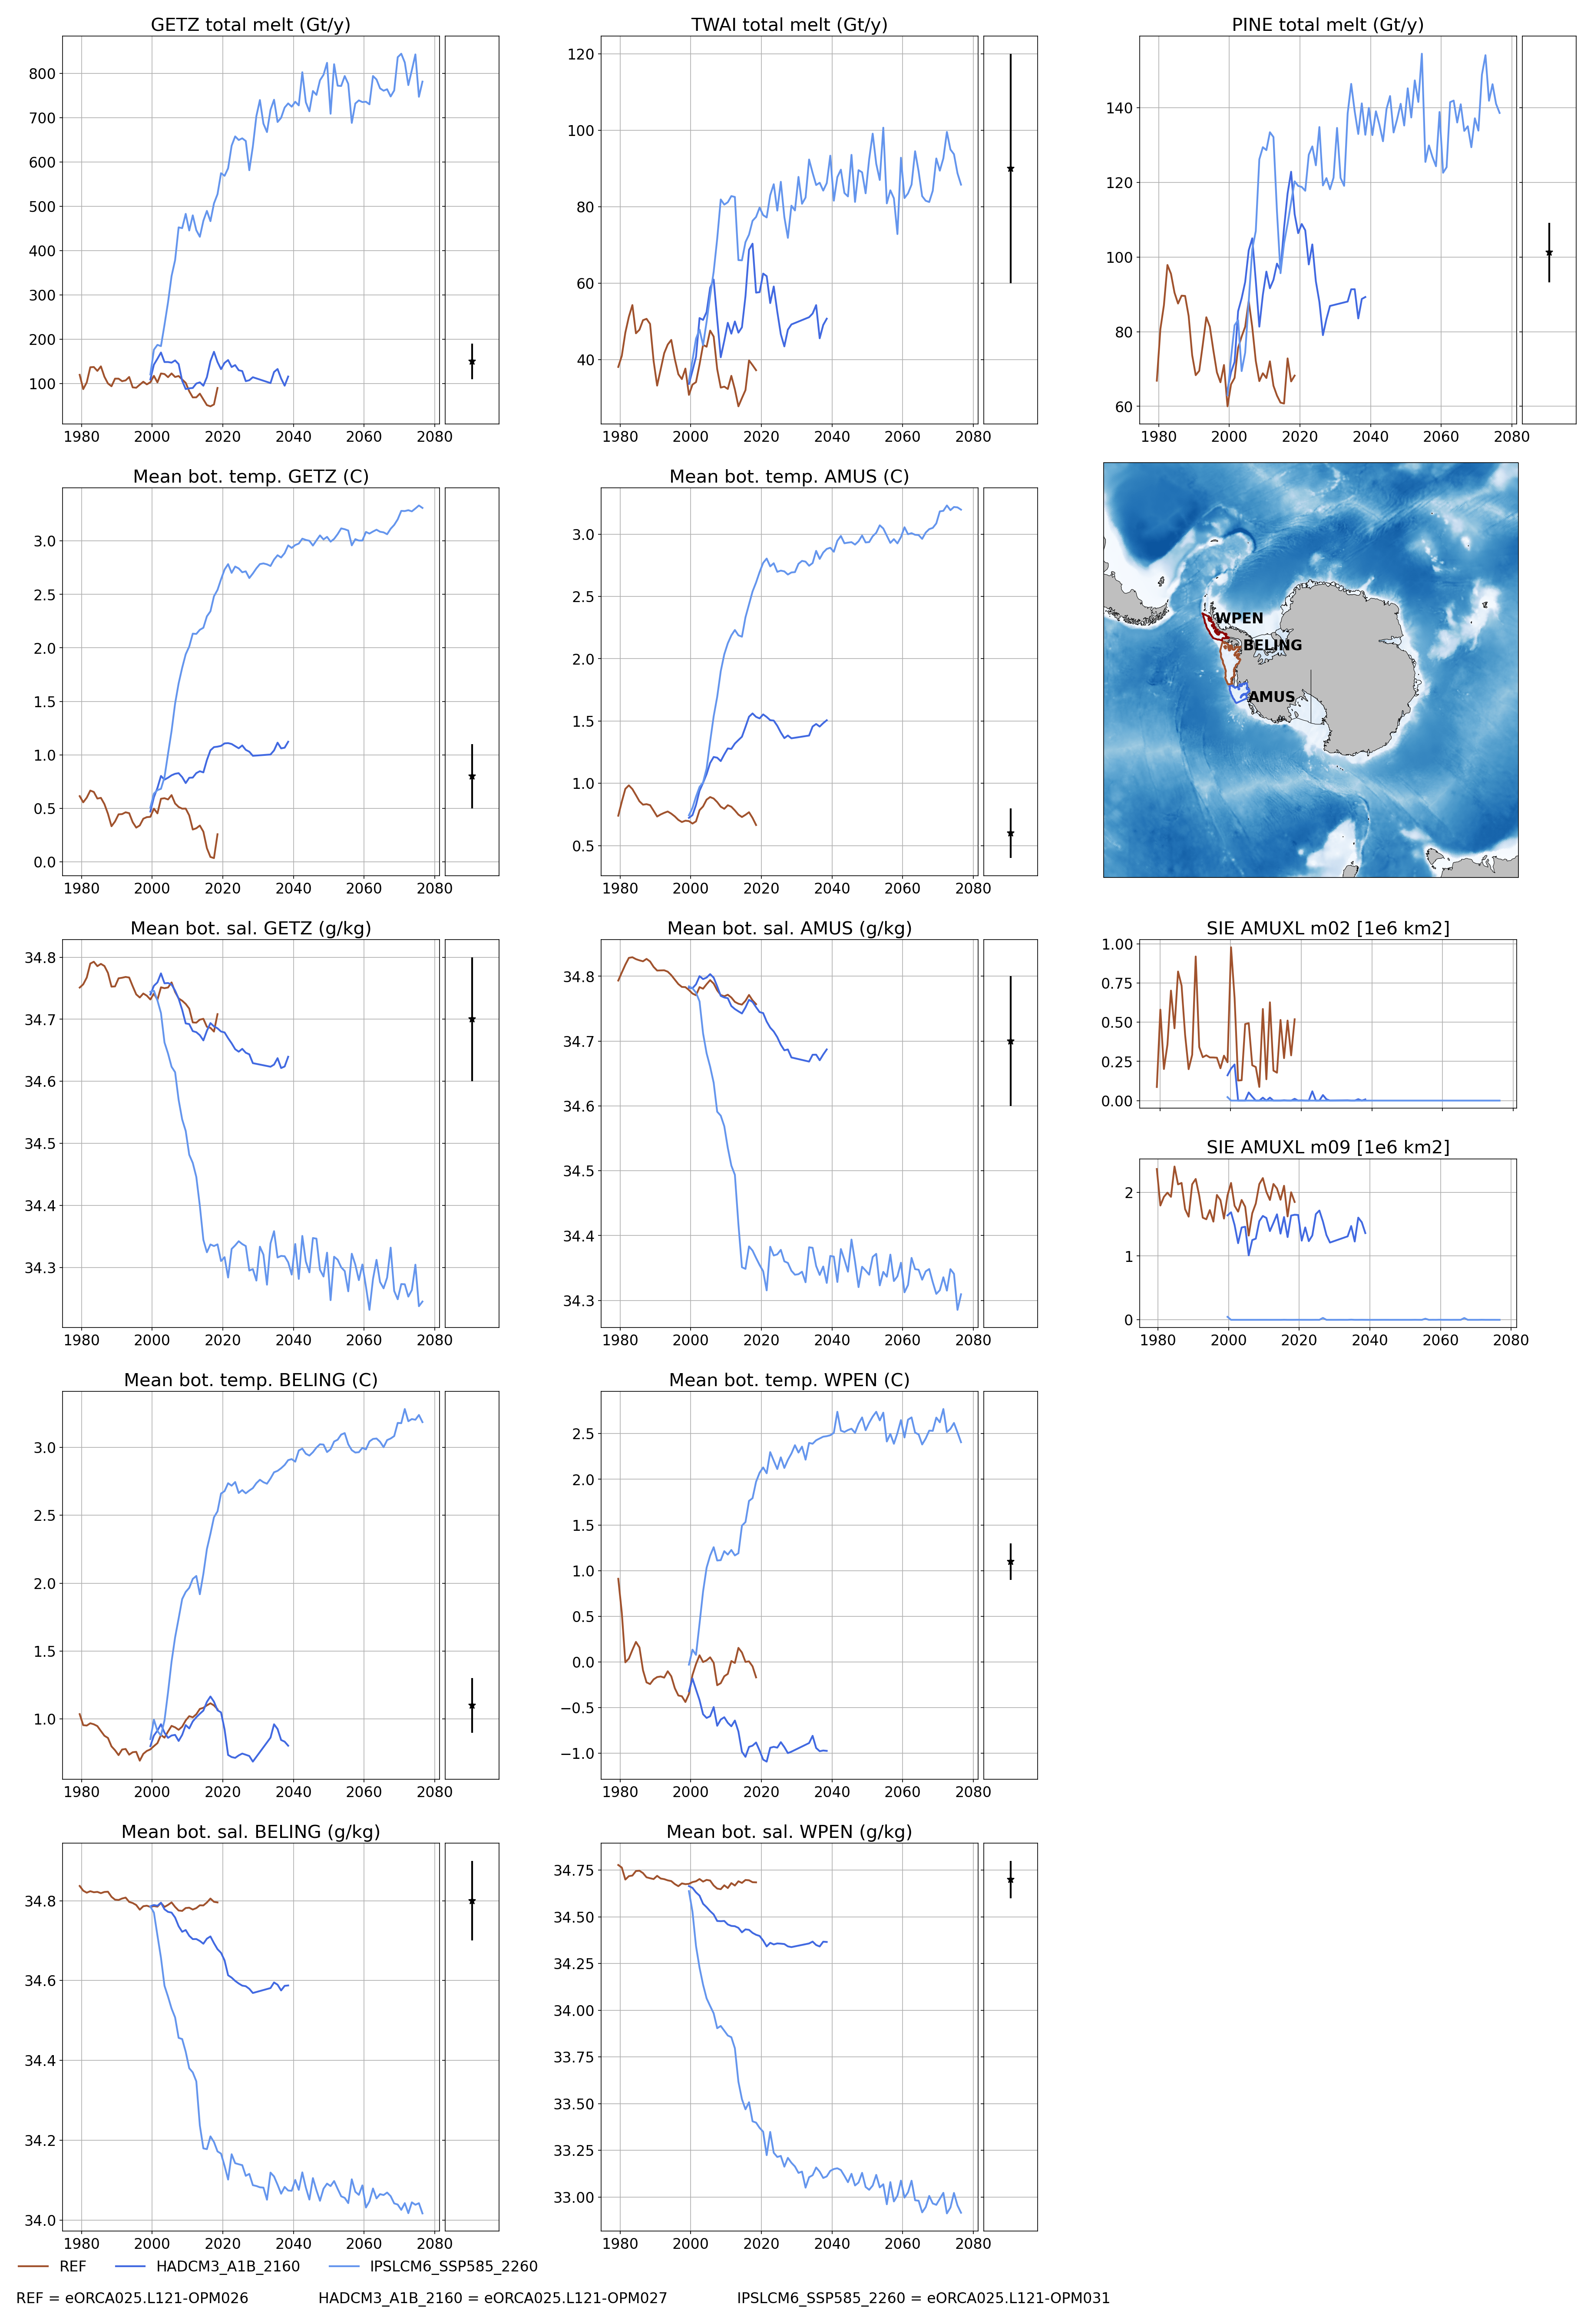
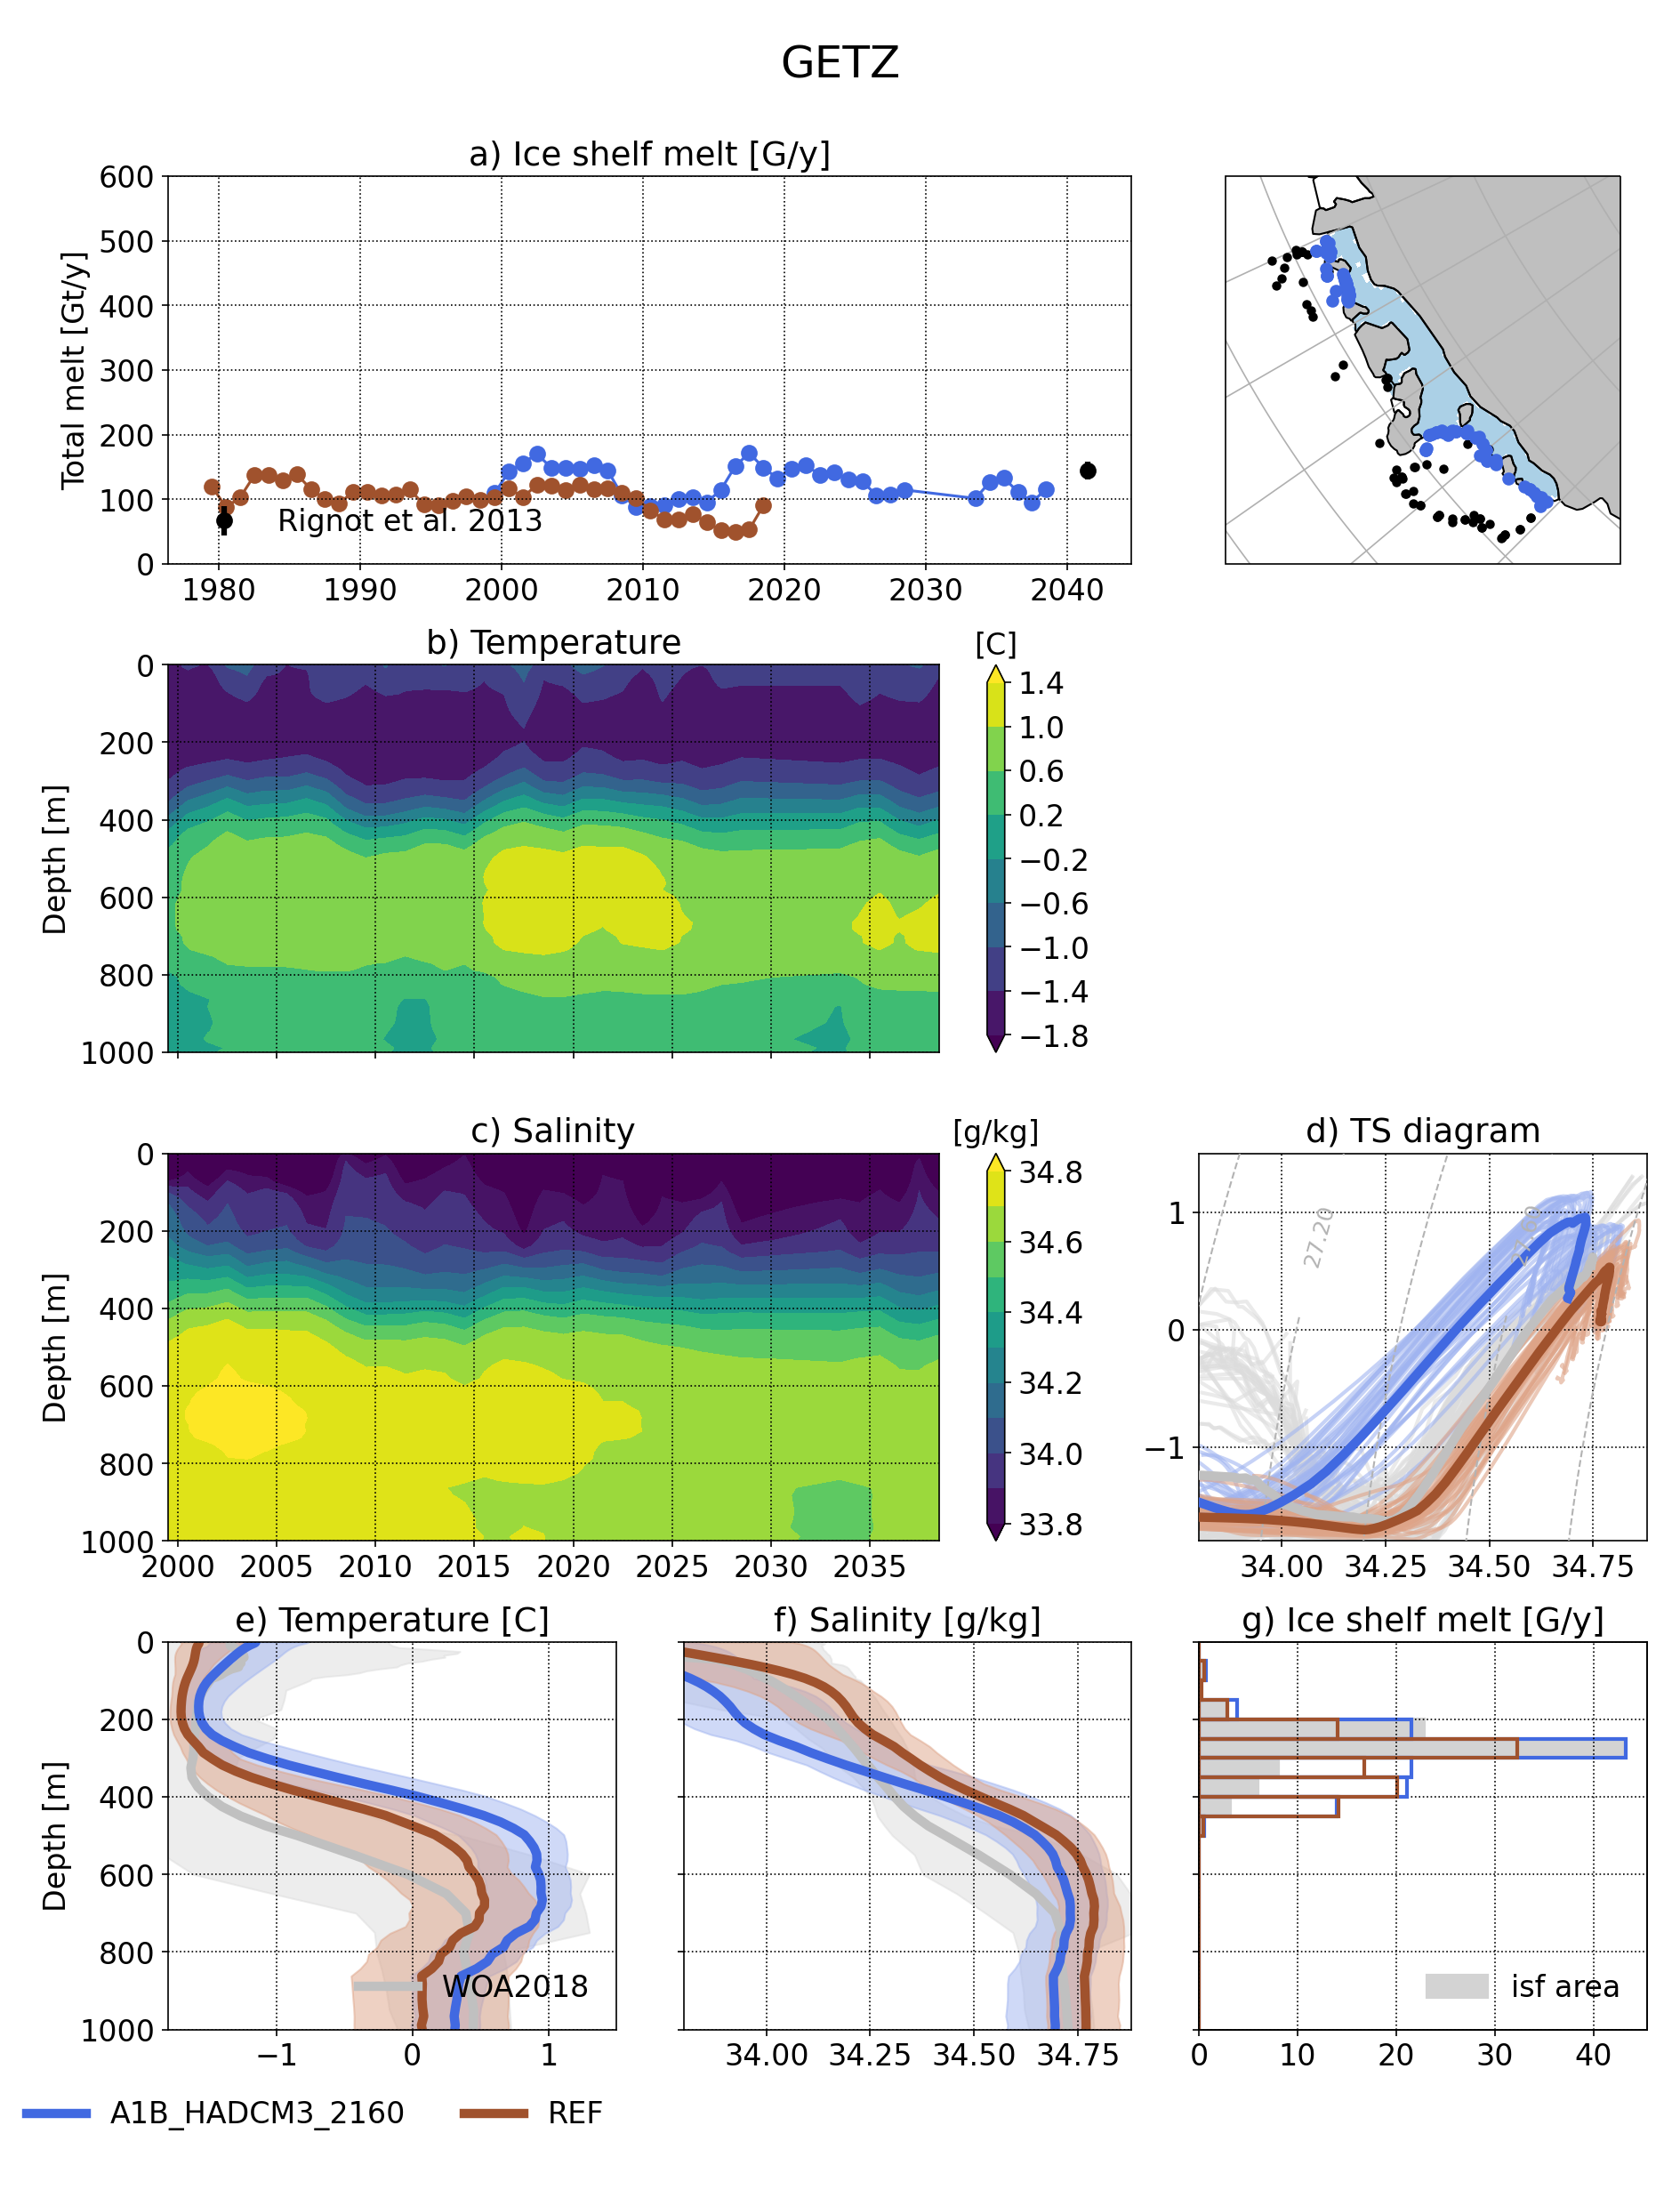
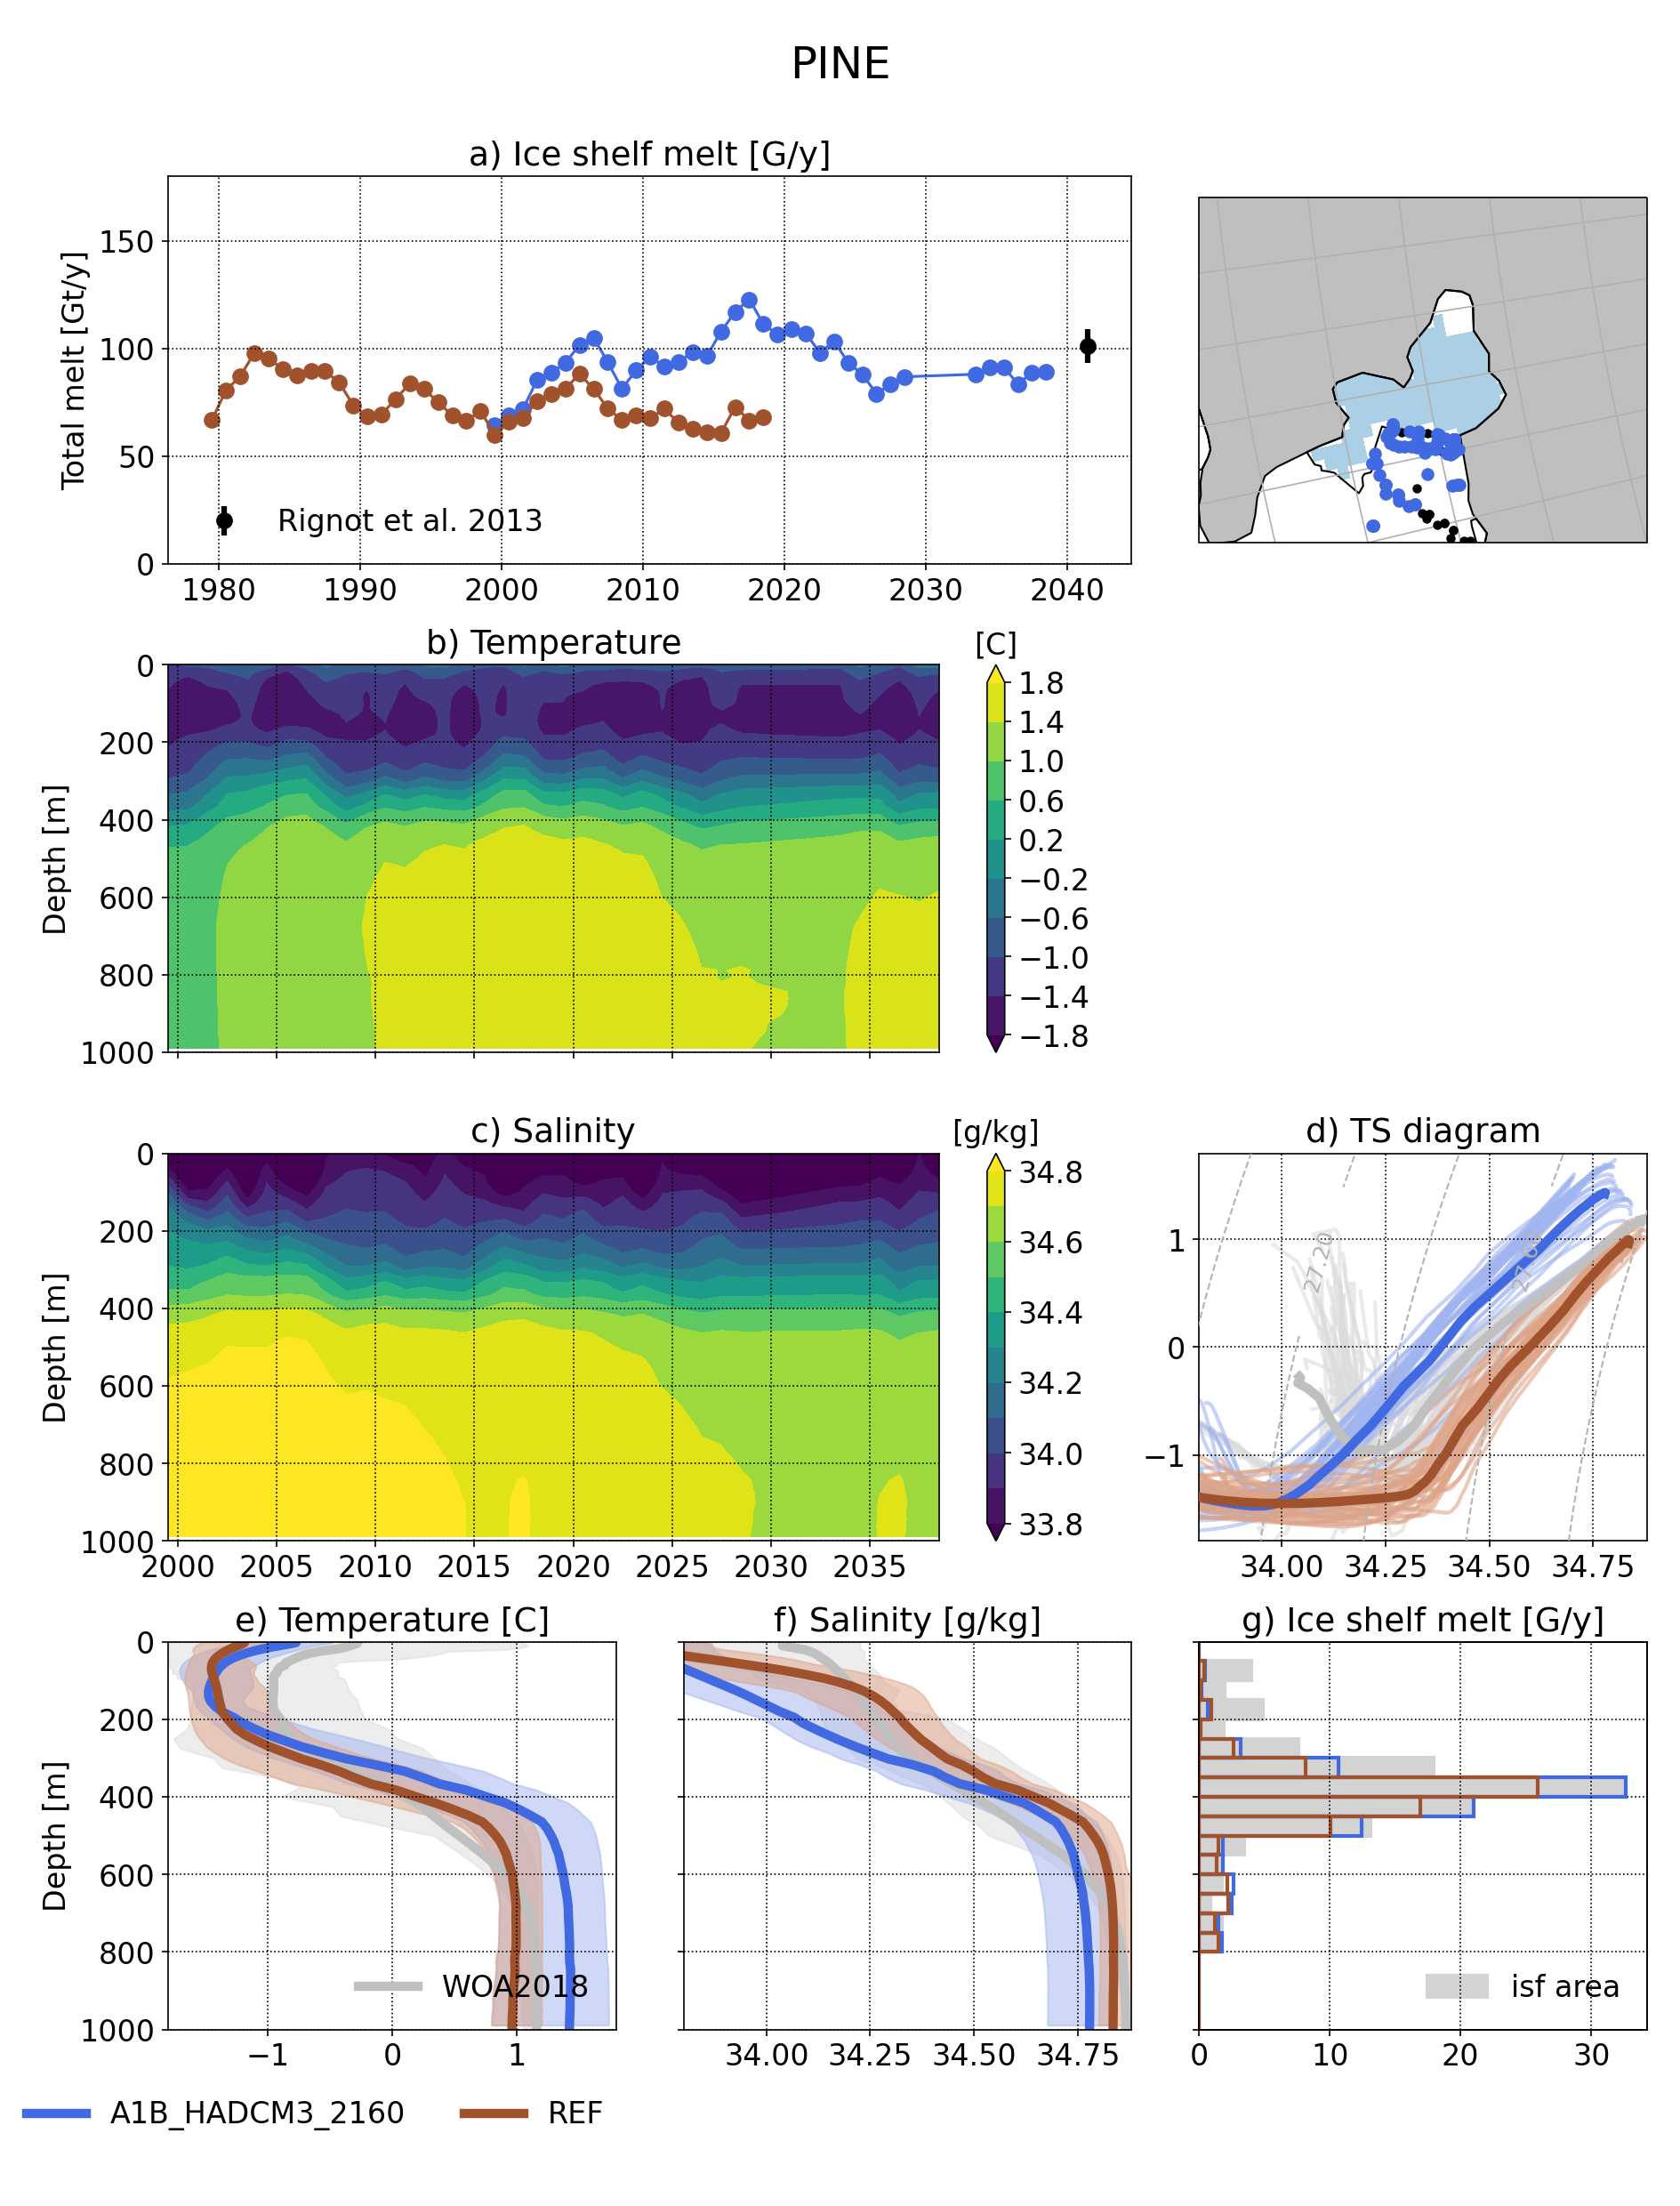
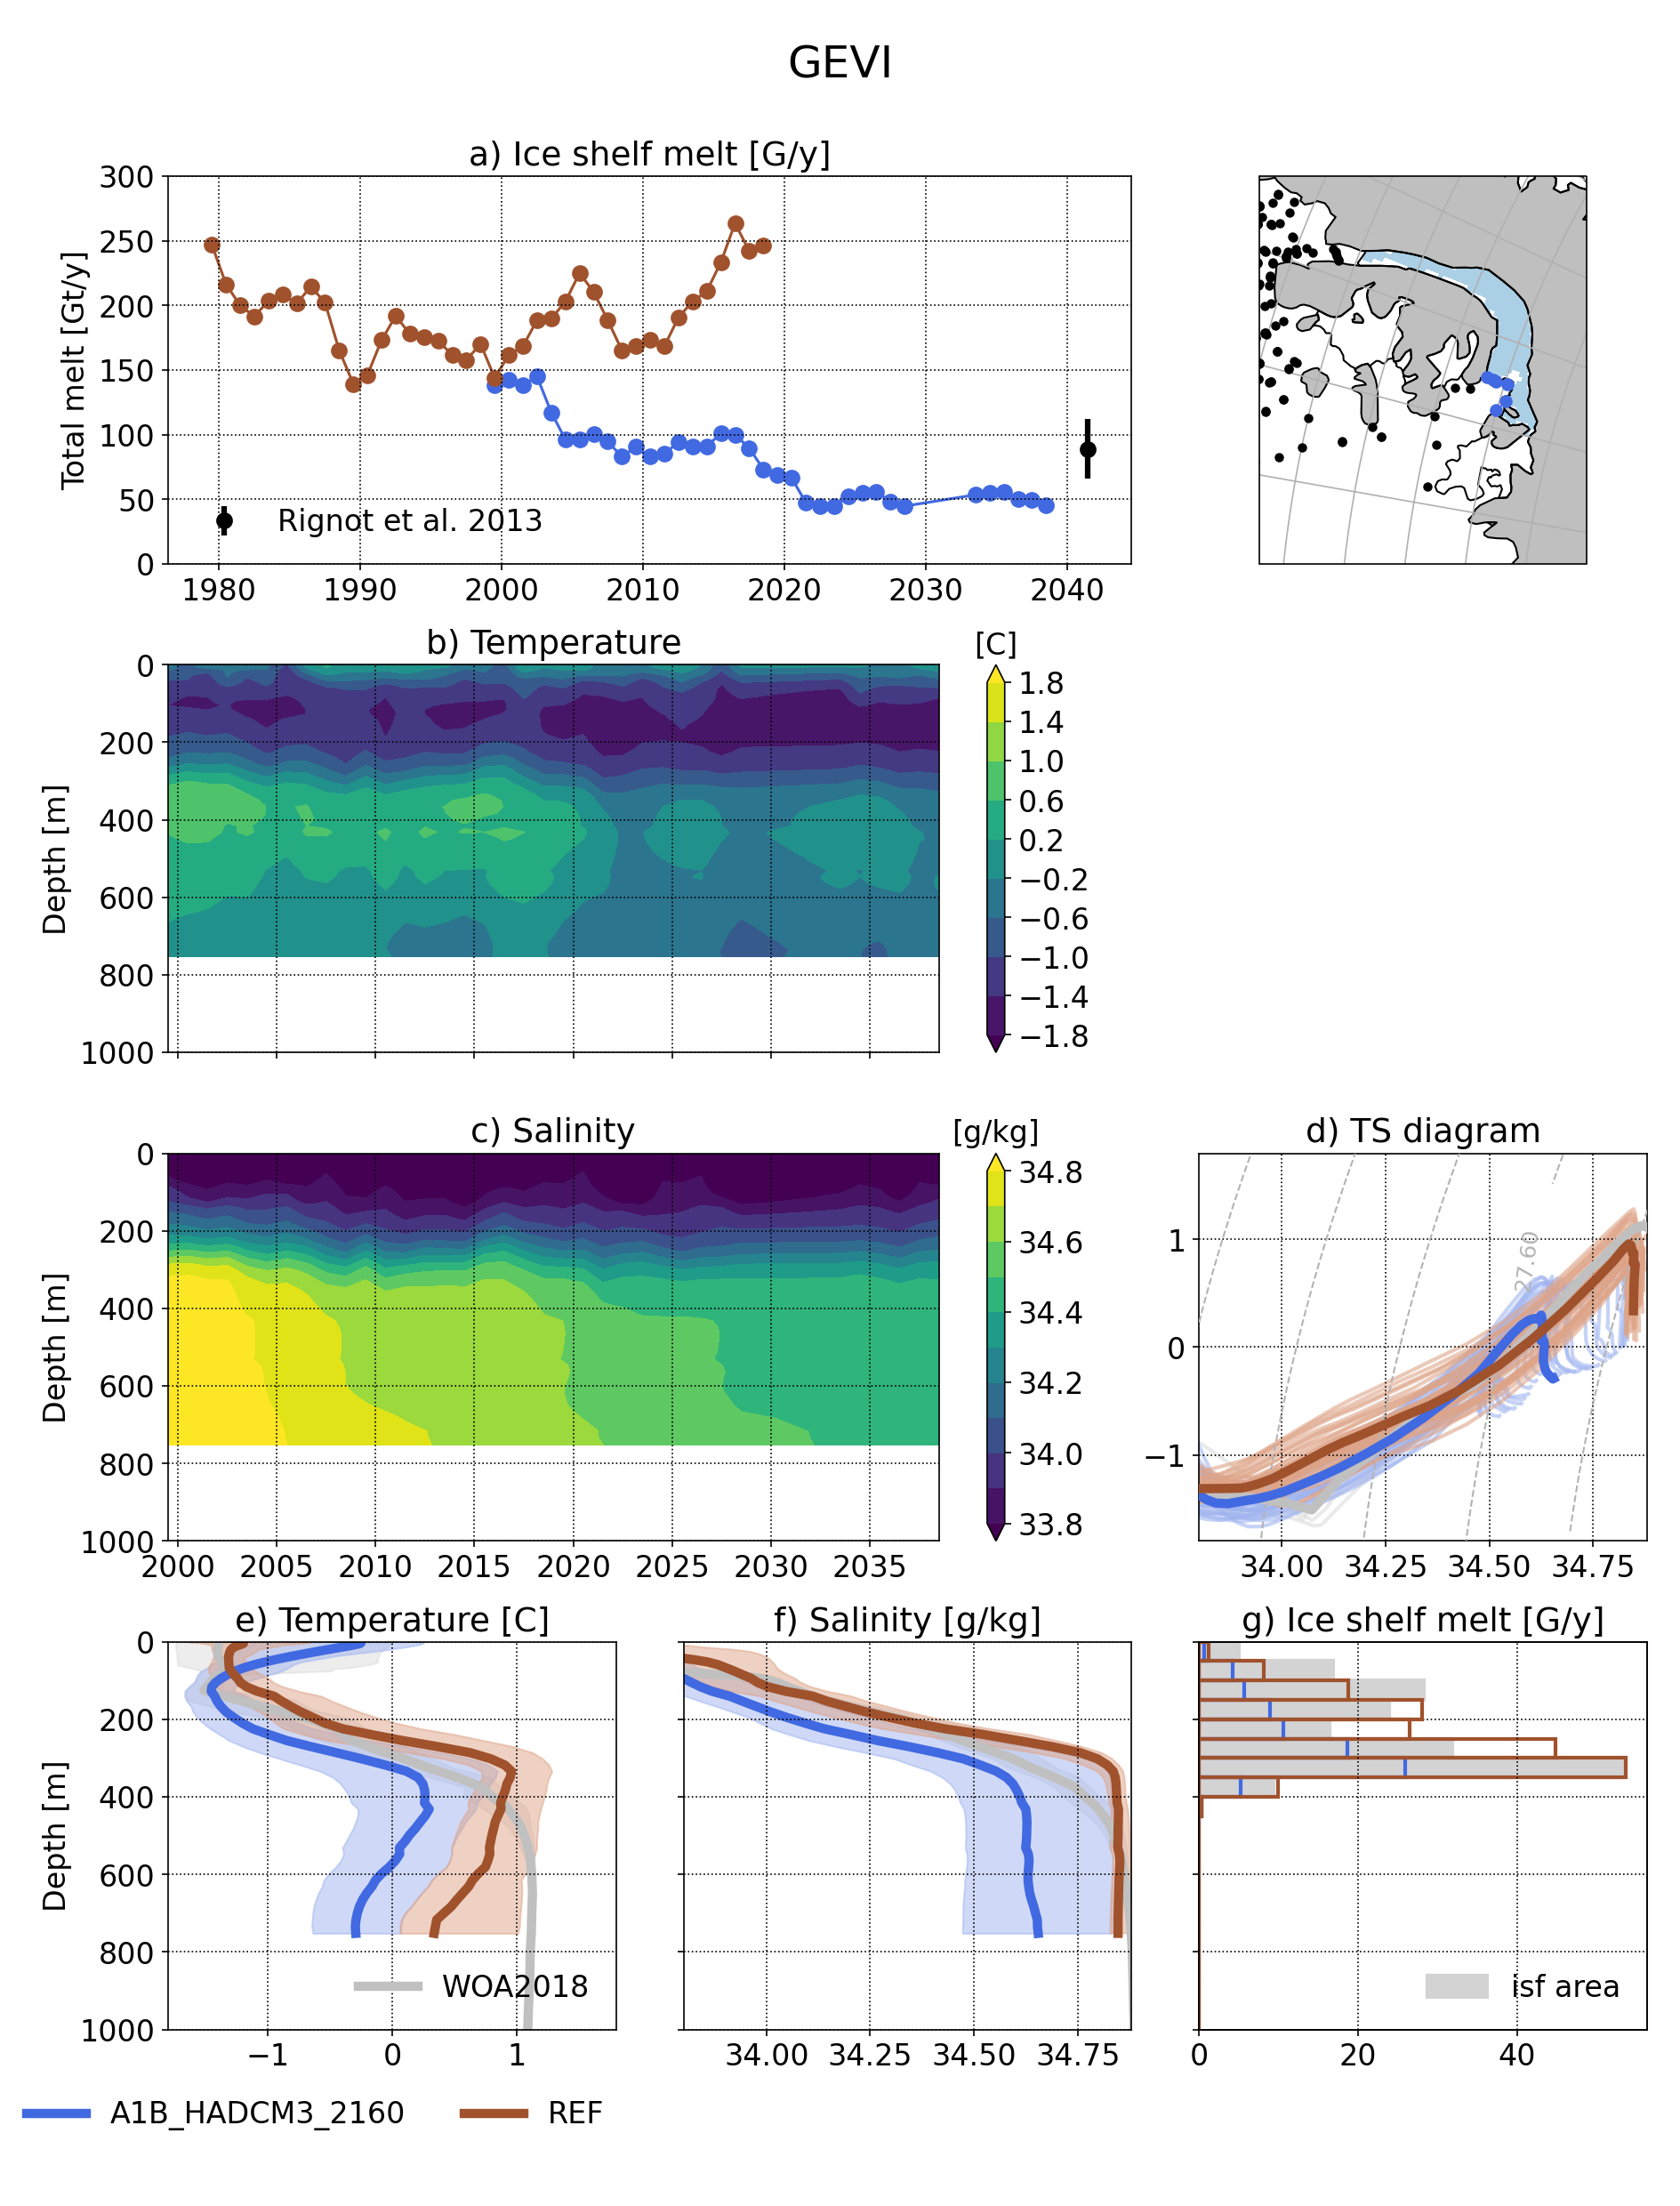
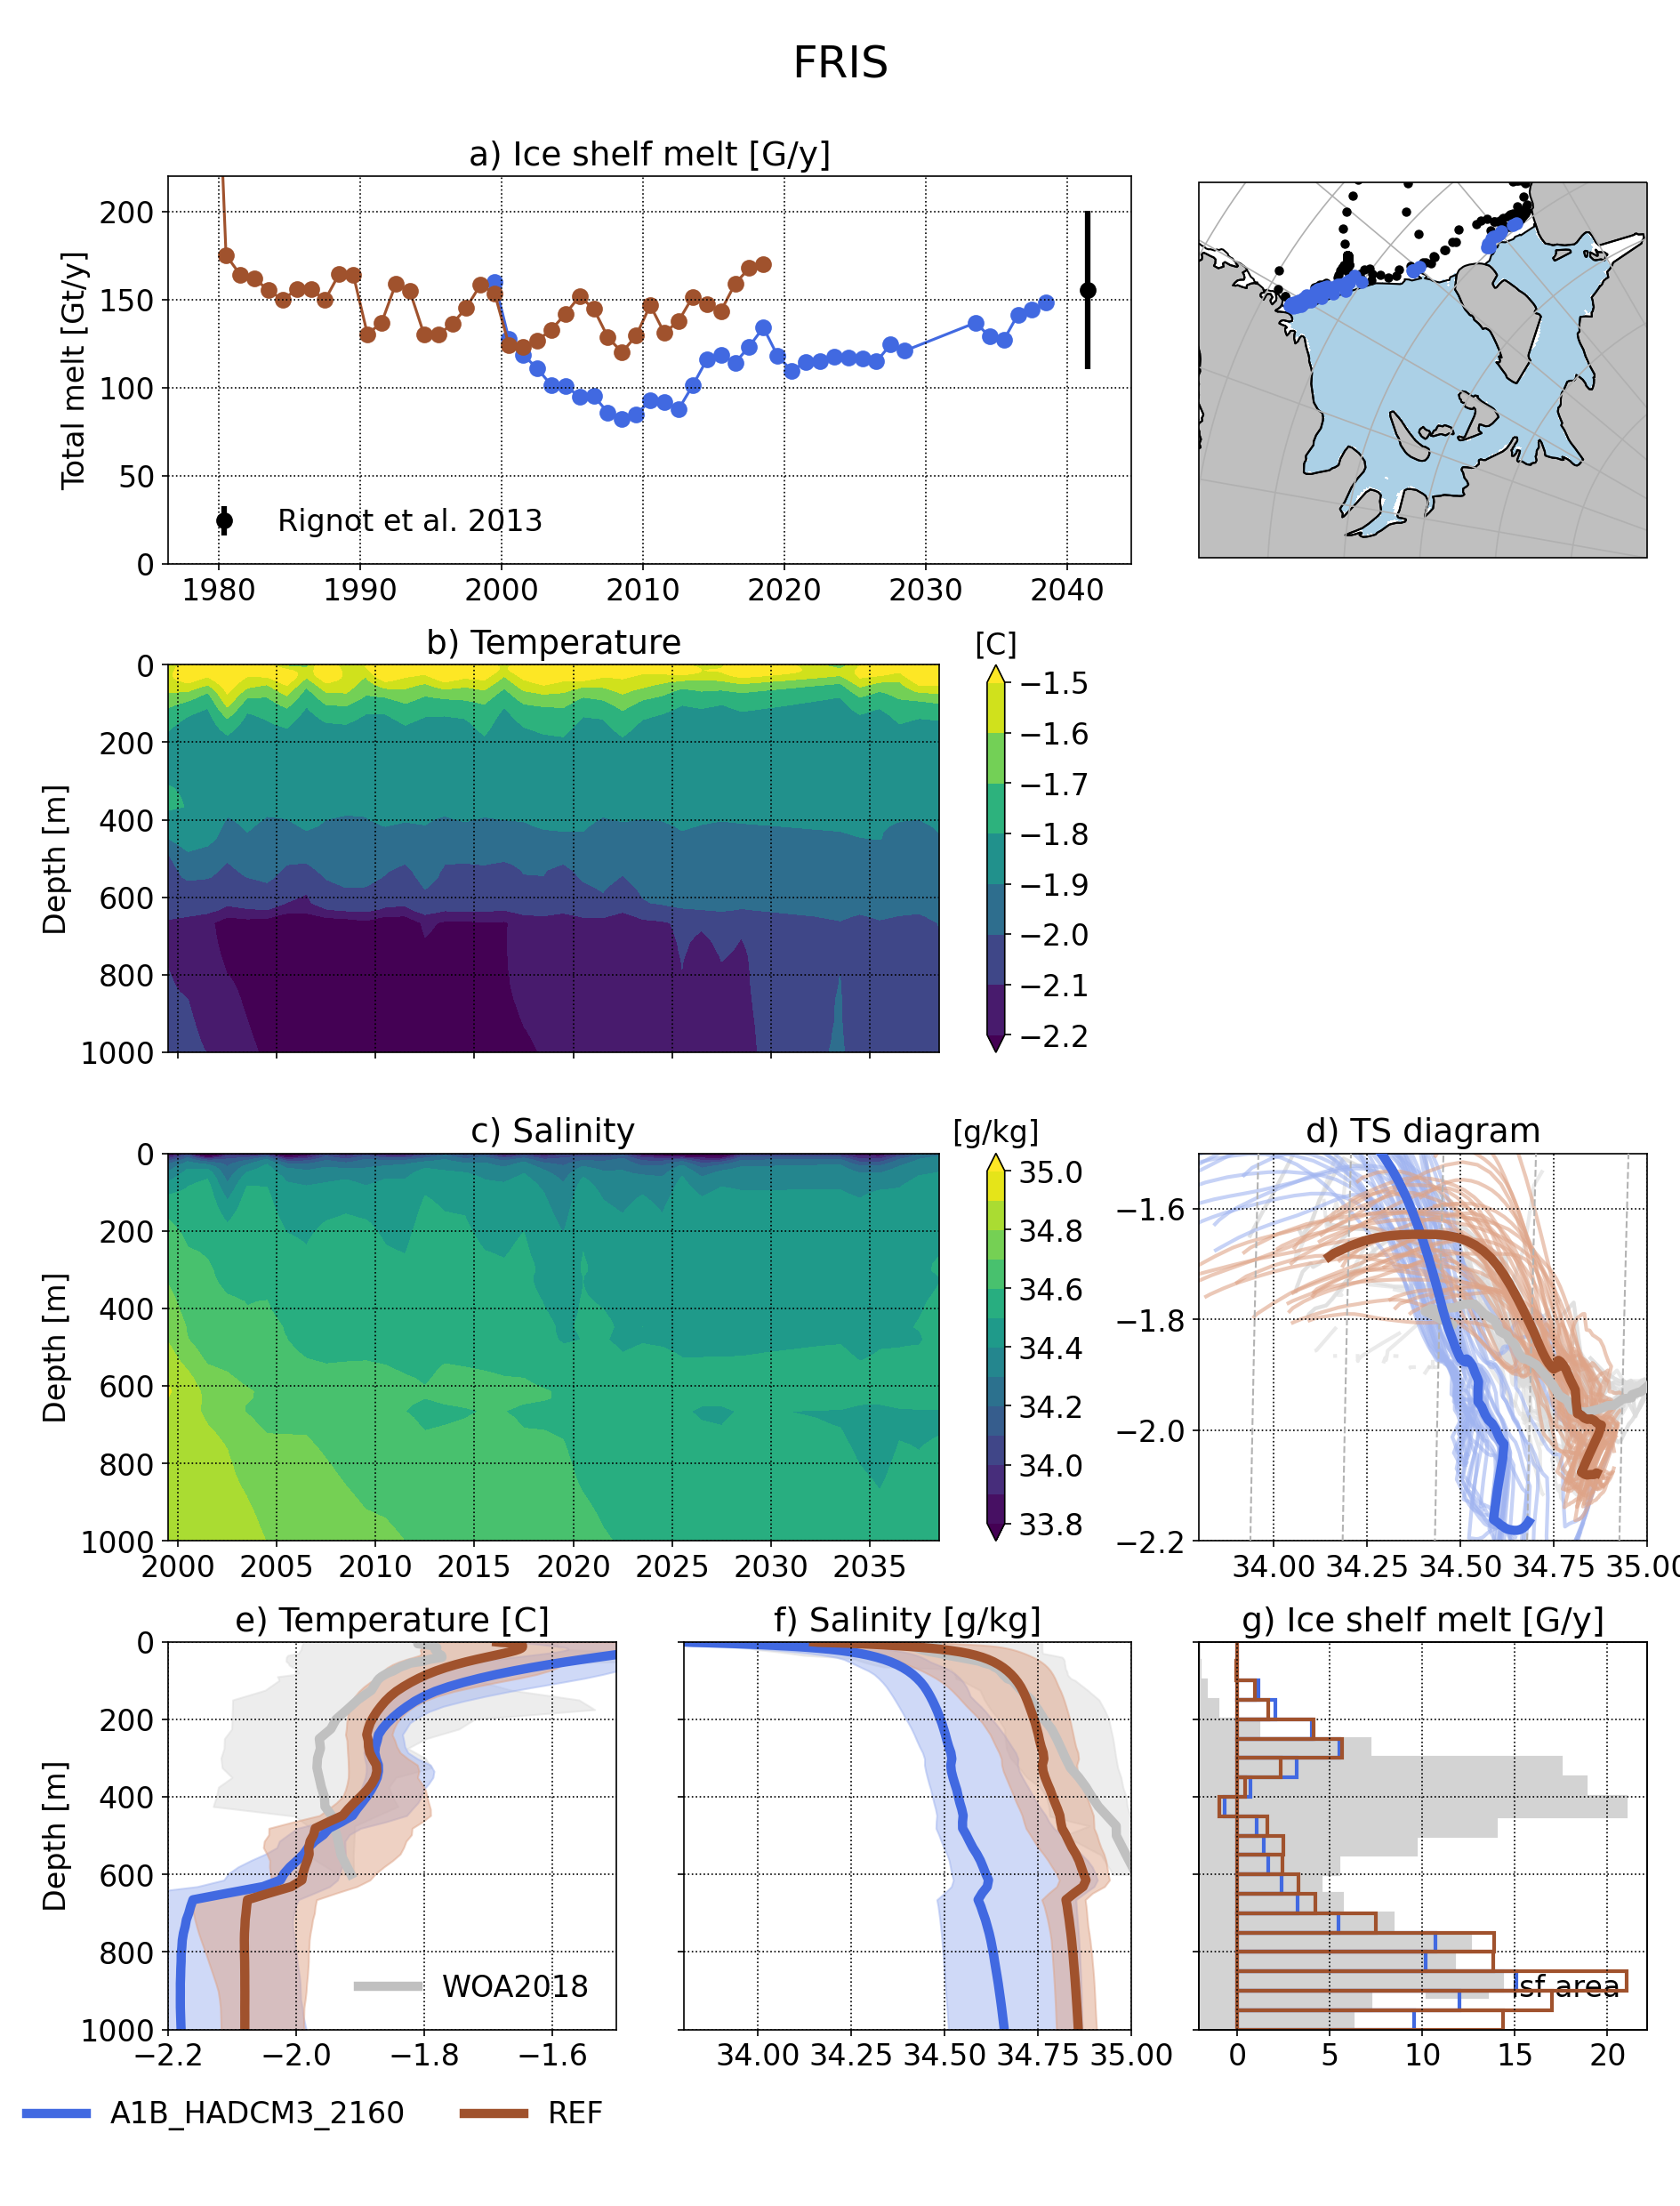
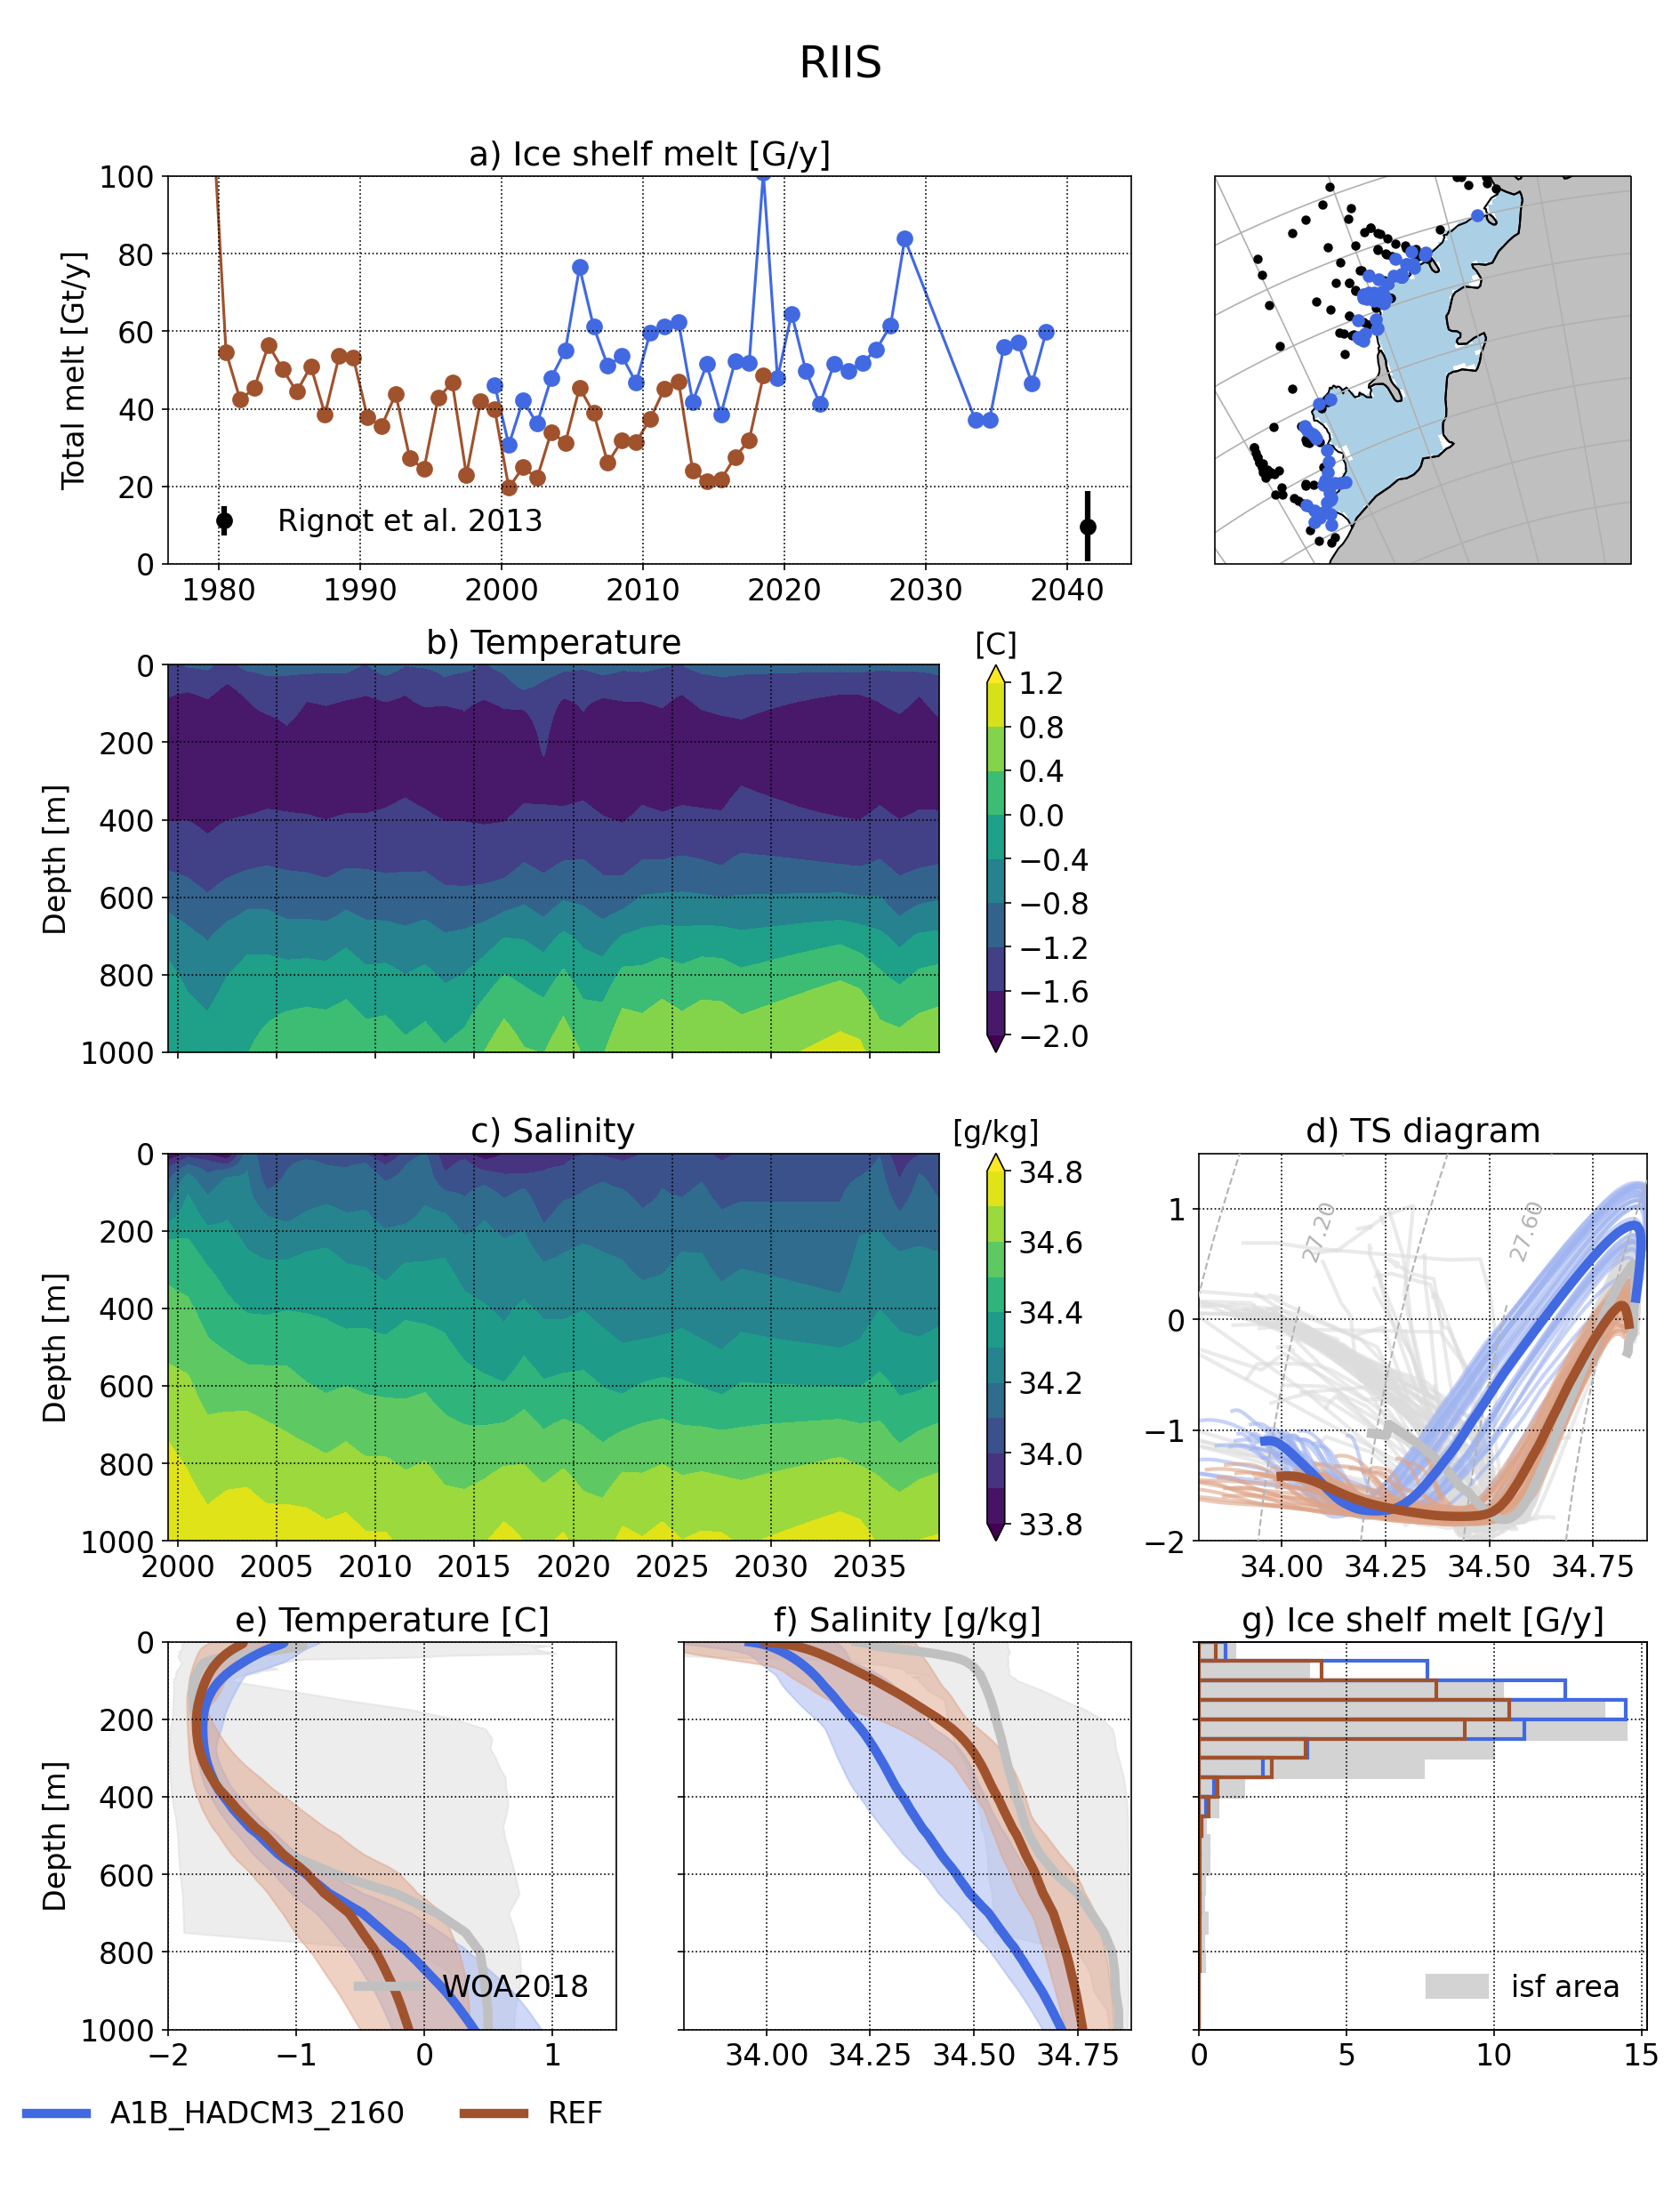
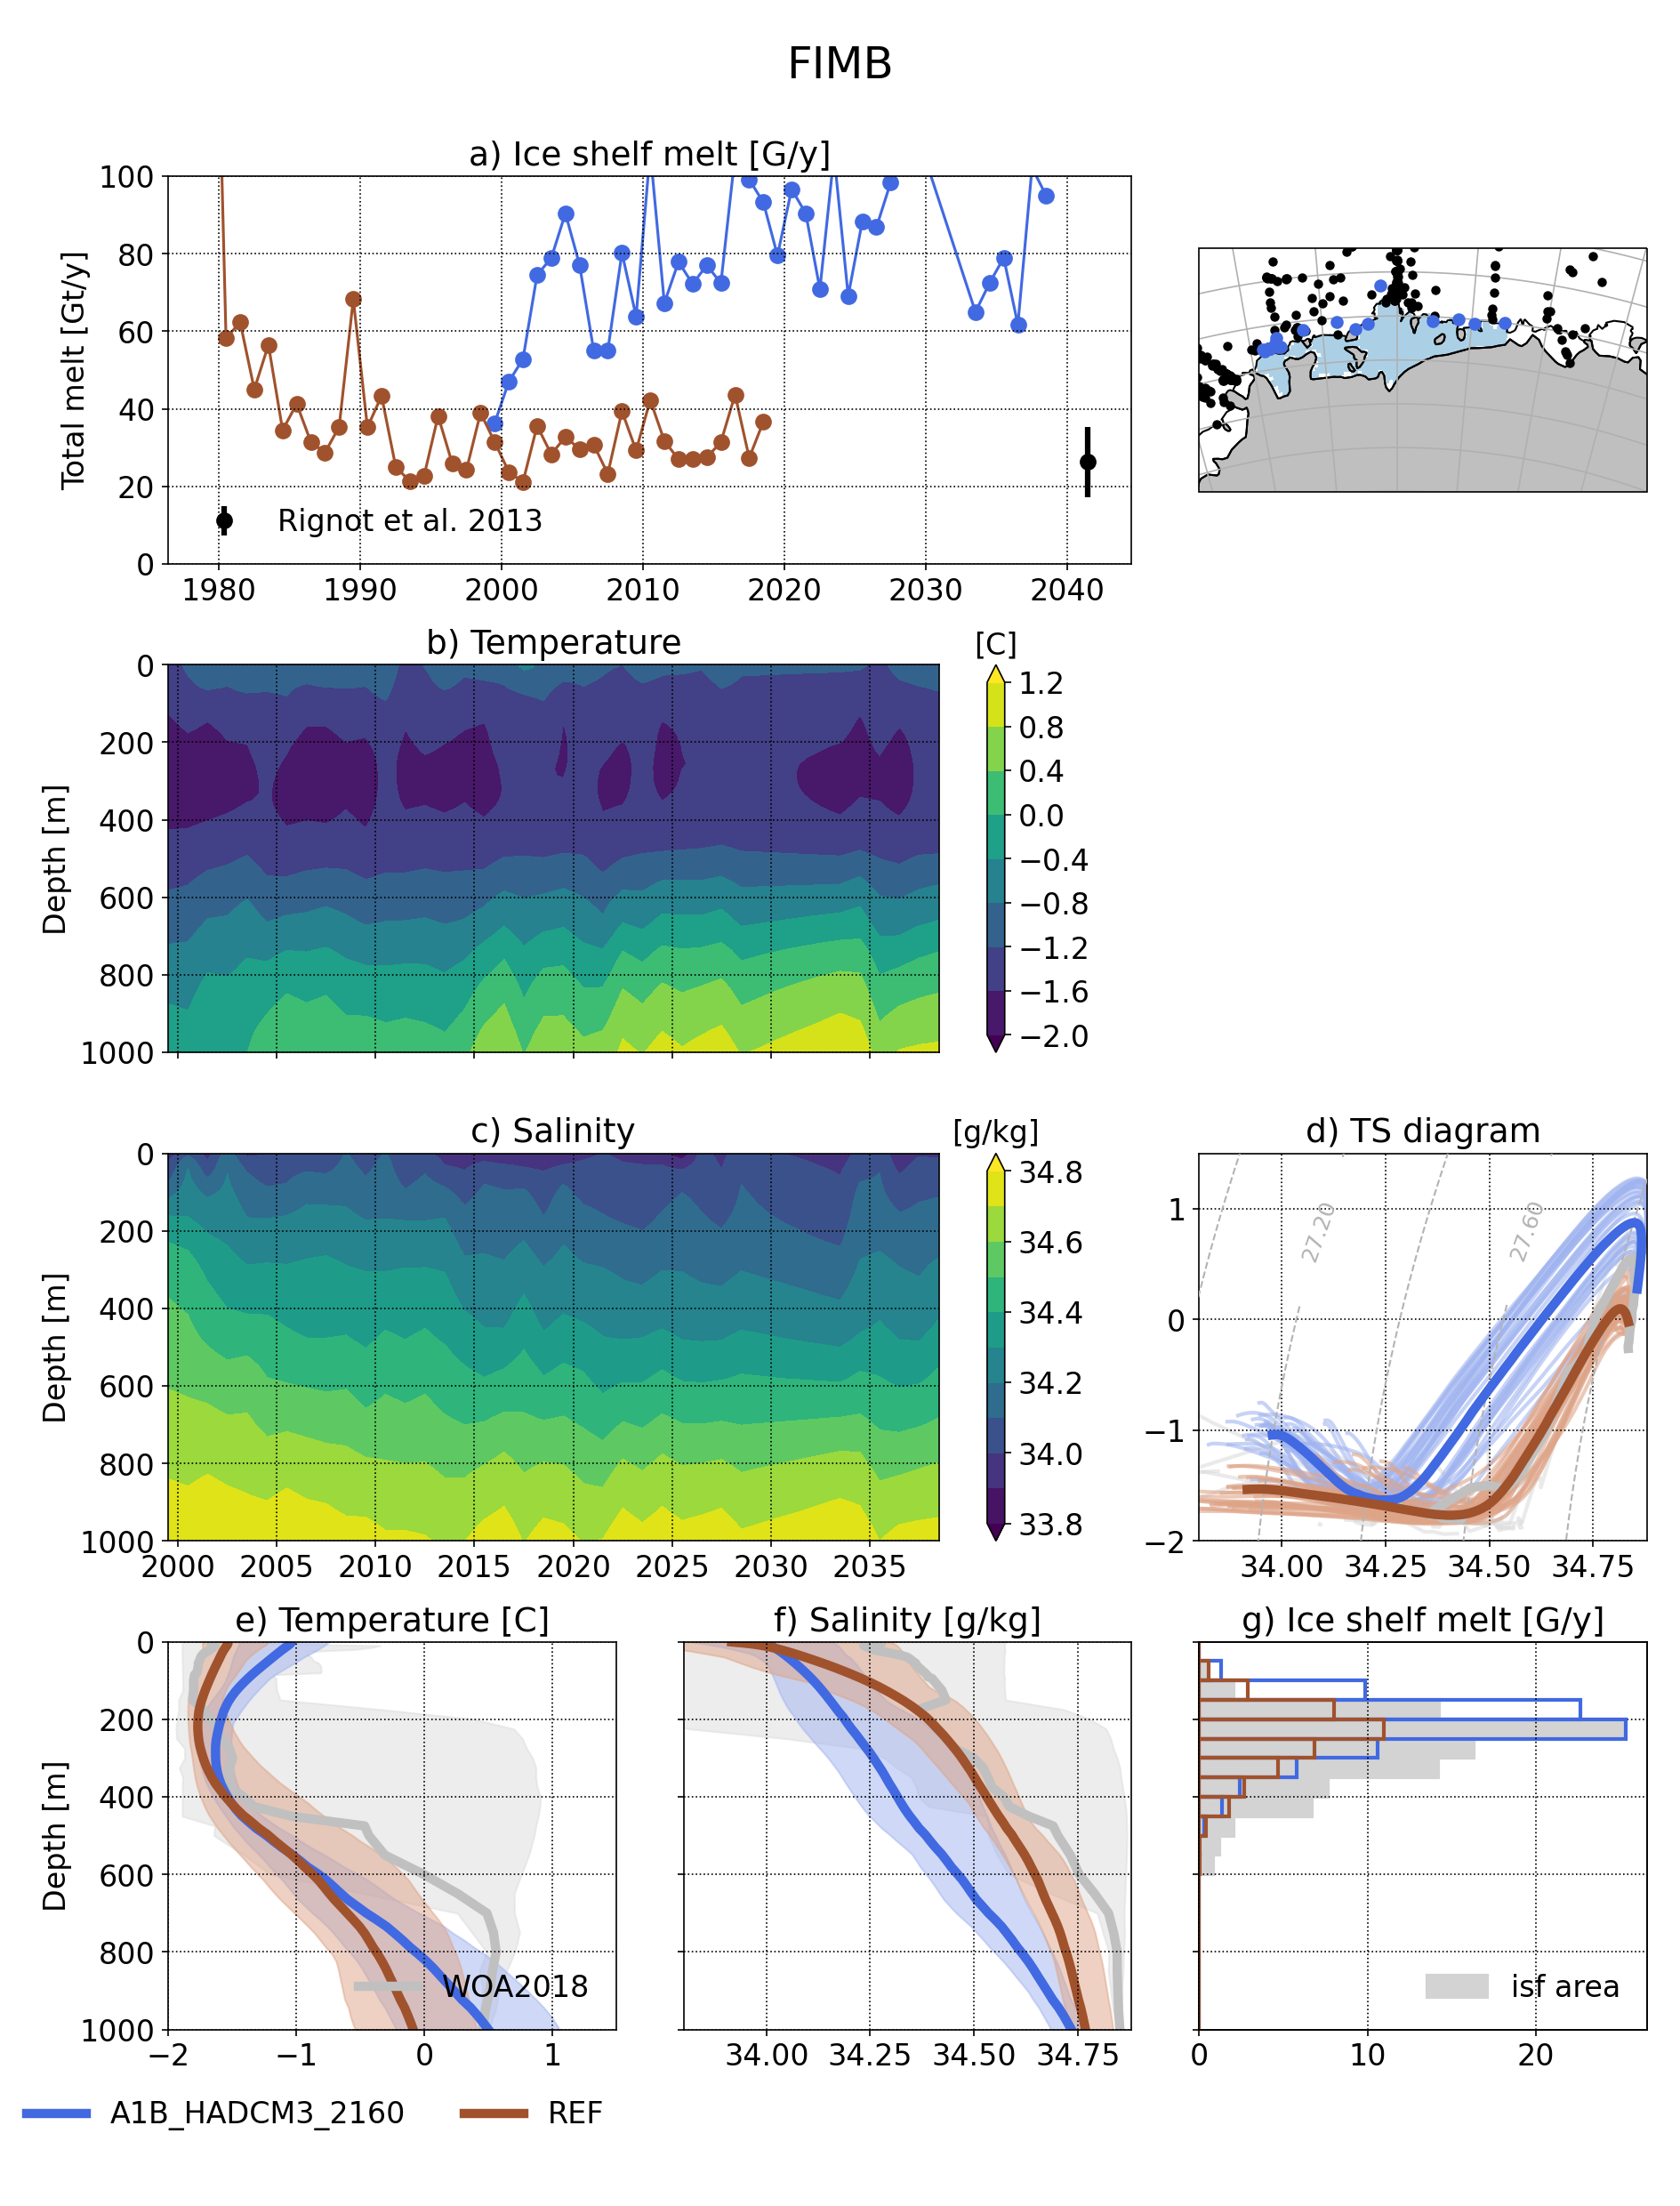
Local indicators
These plots monitor the evolution of ice shelf melting and the corresponding shelf properties (ROSS, FRIS, PINE, GETZ)
Amundsen/Belingshausen seas
These plot monitoring the evolution of temperature, salinity and ice shelf melt in Amundsen sea.
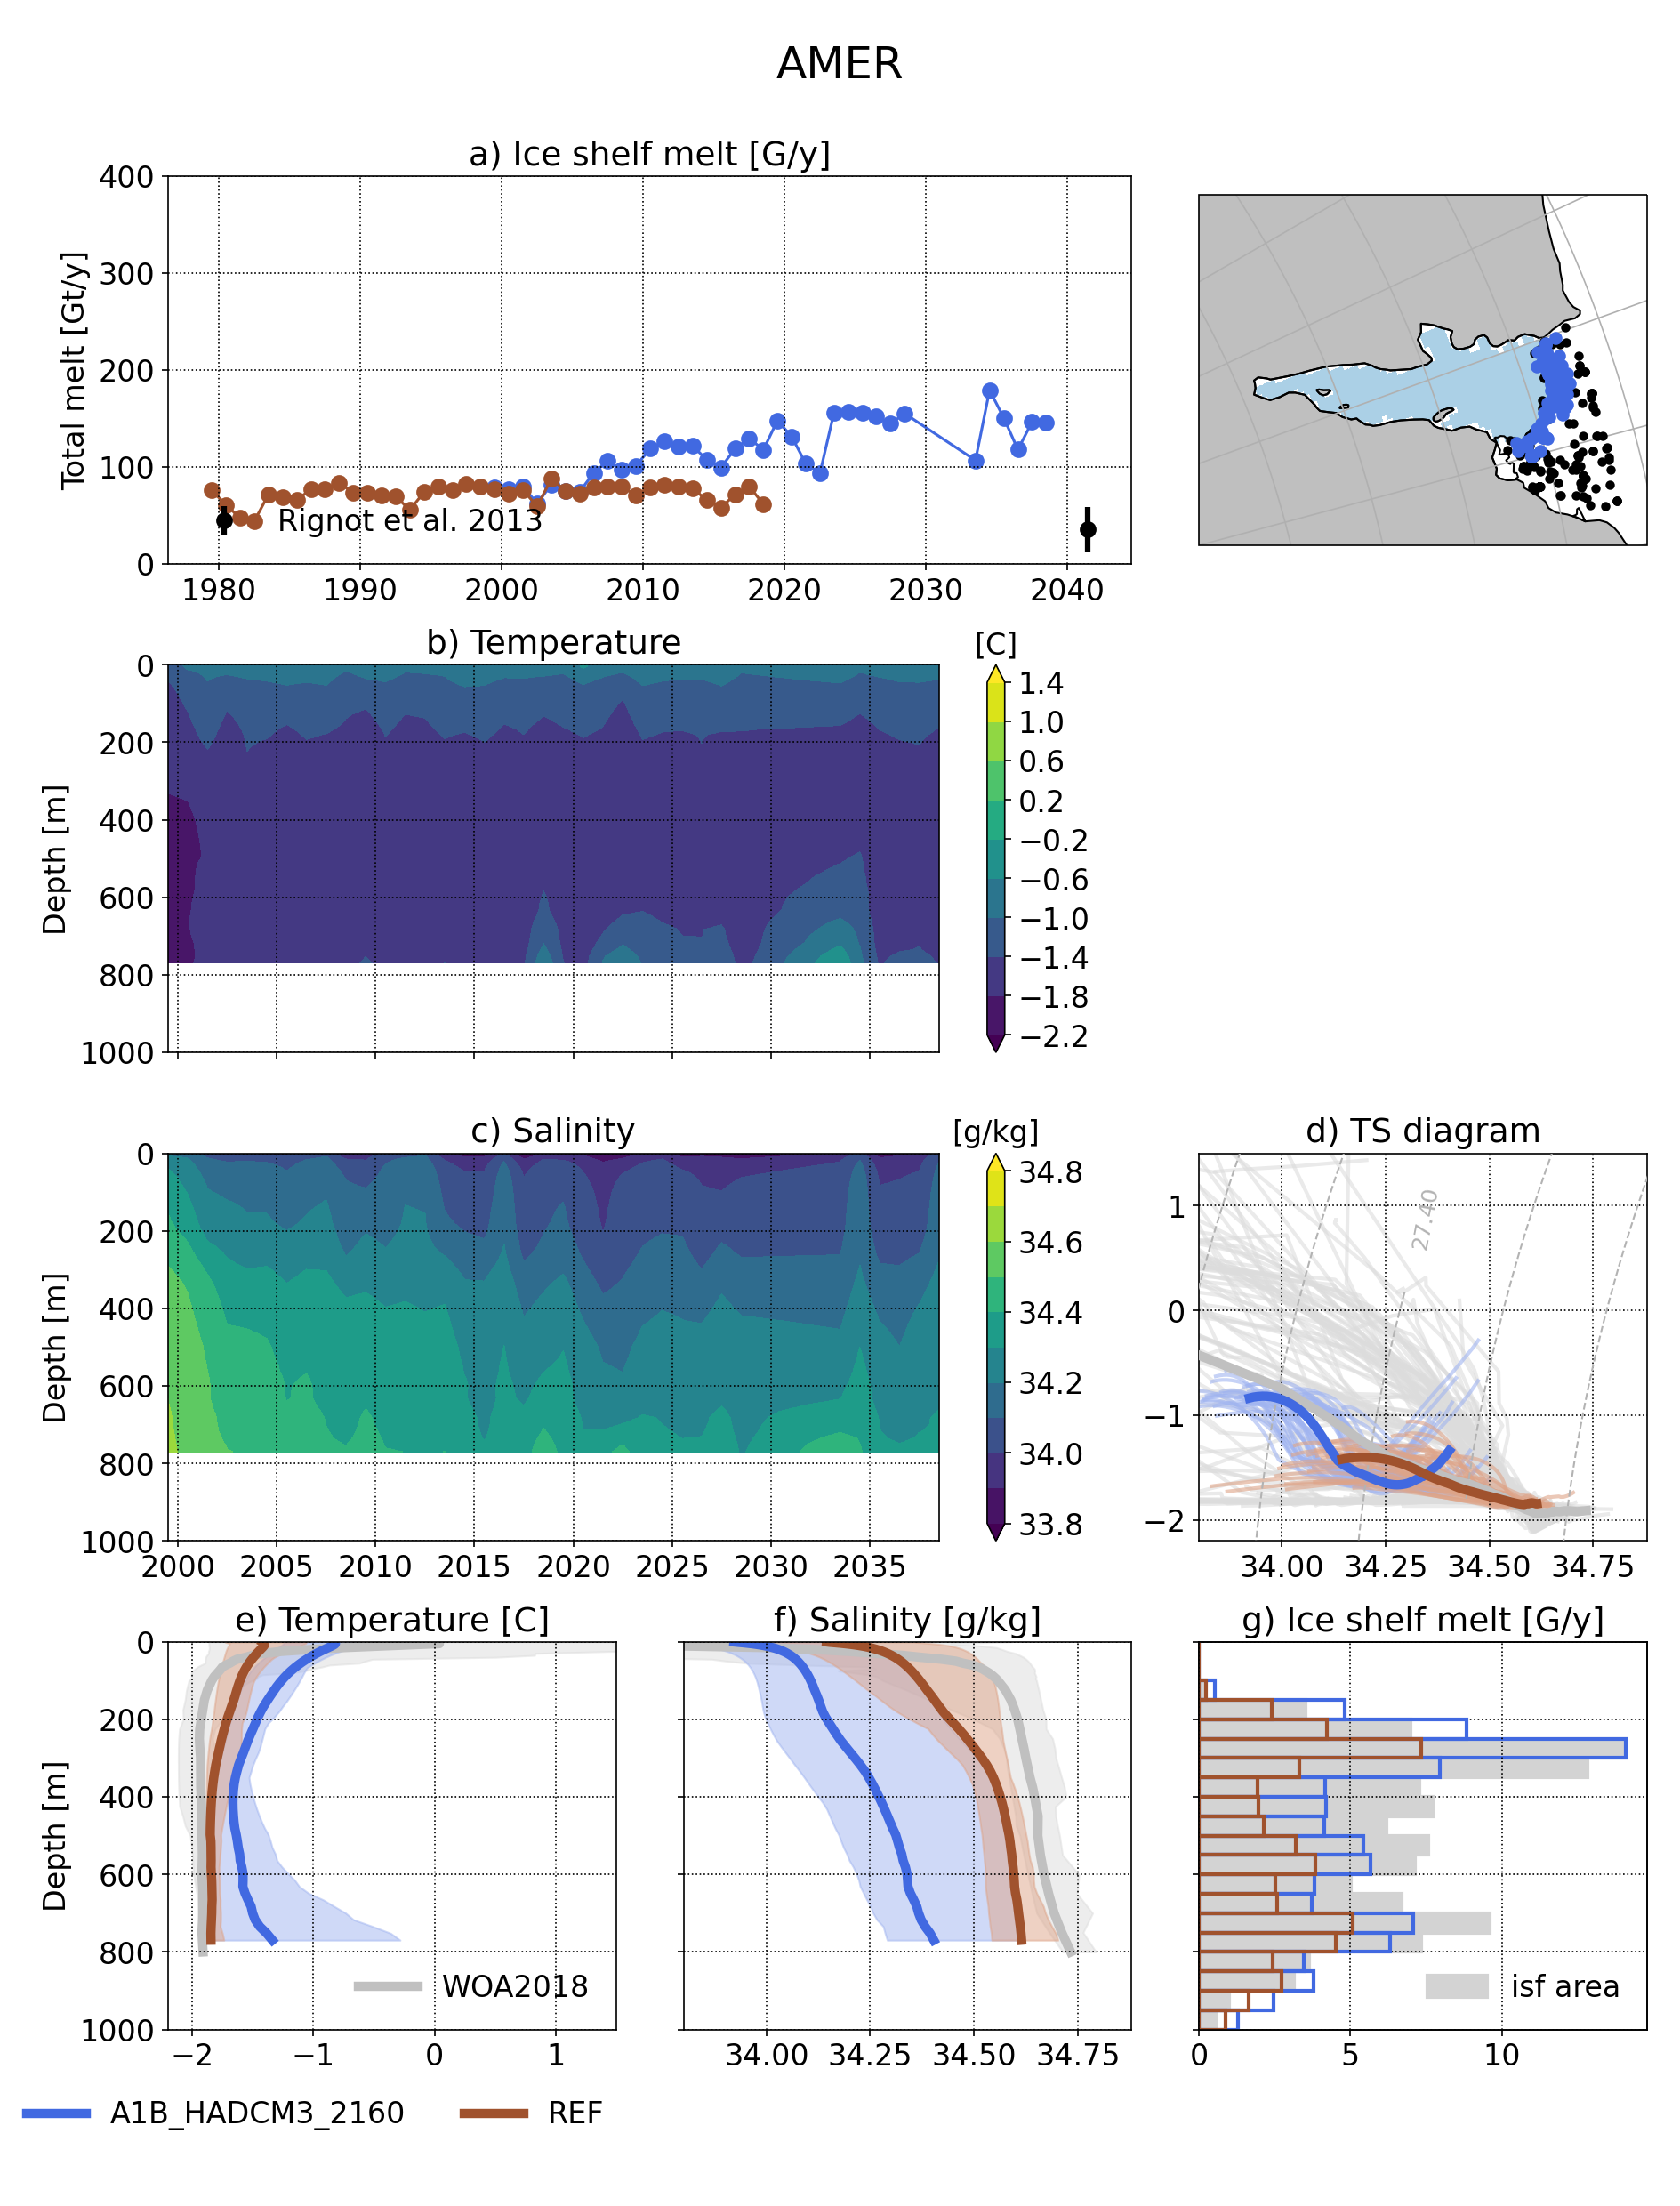
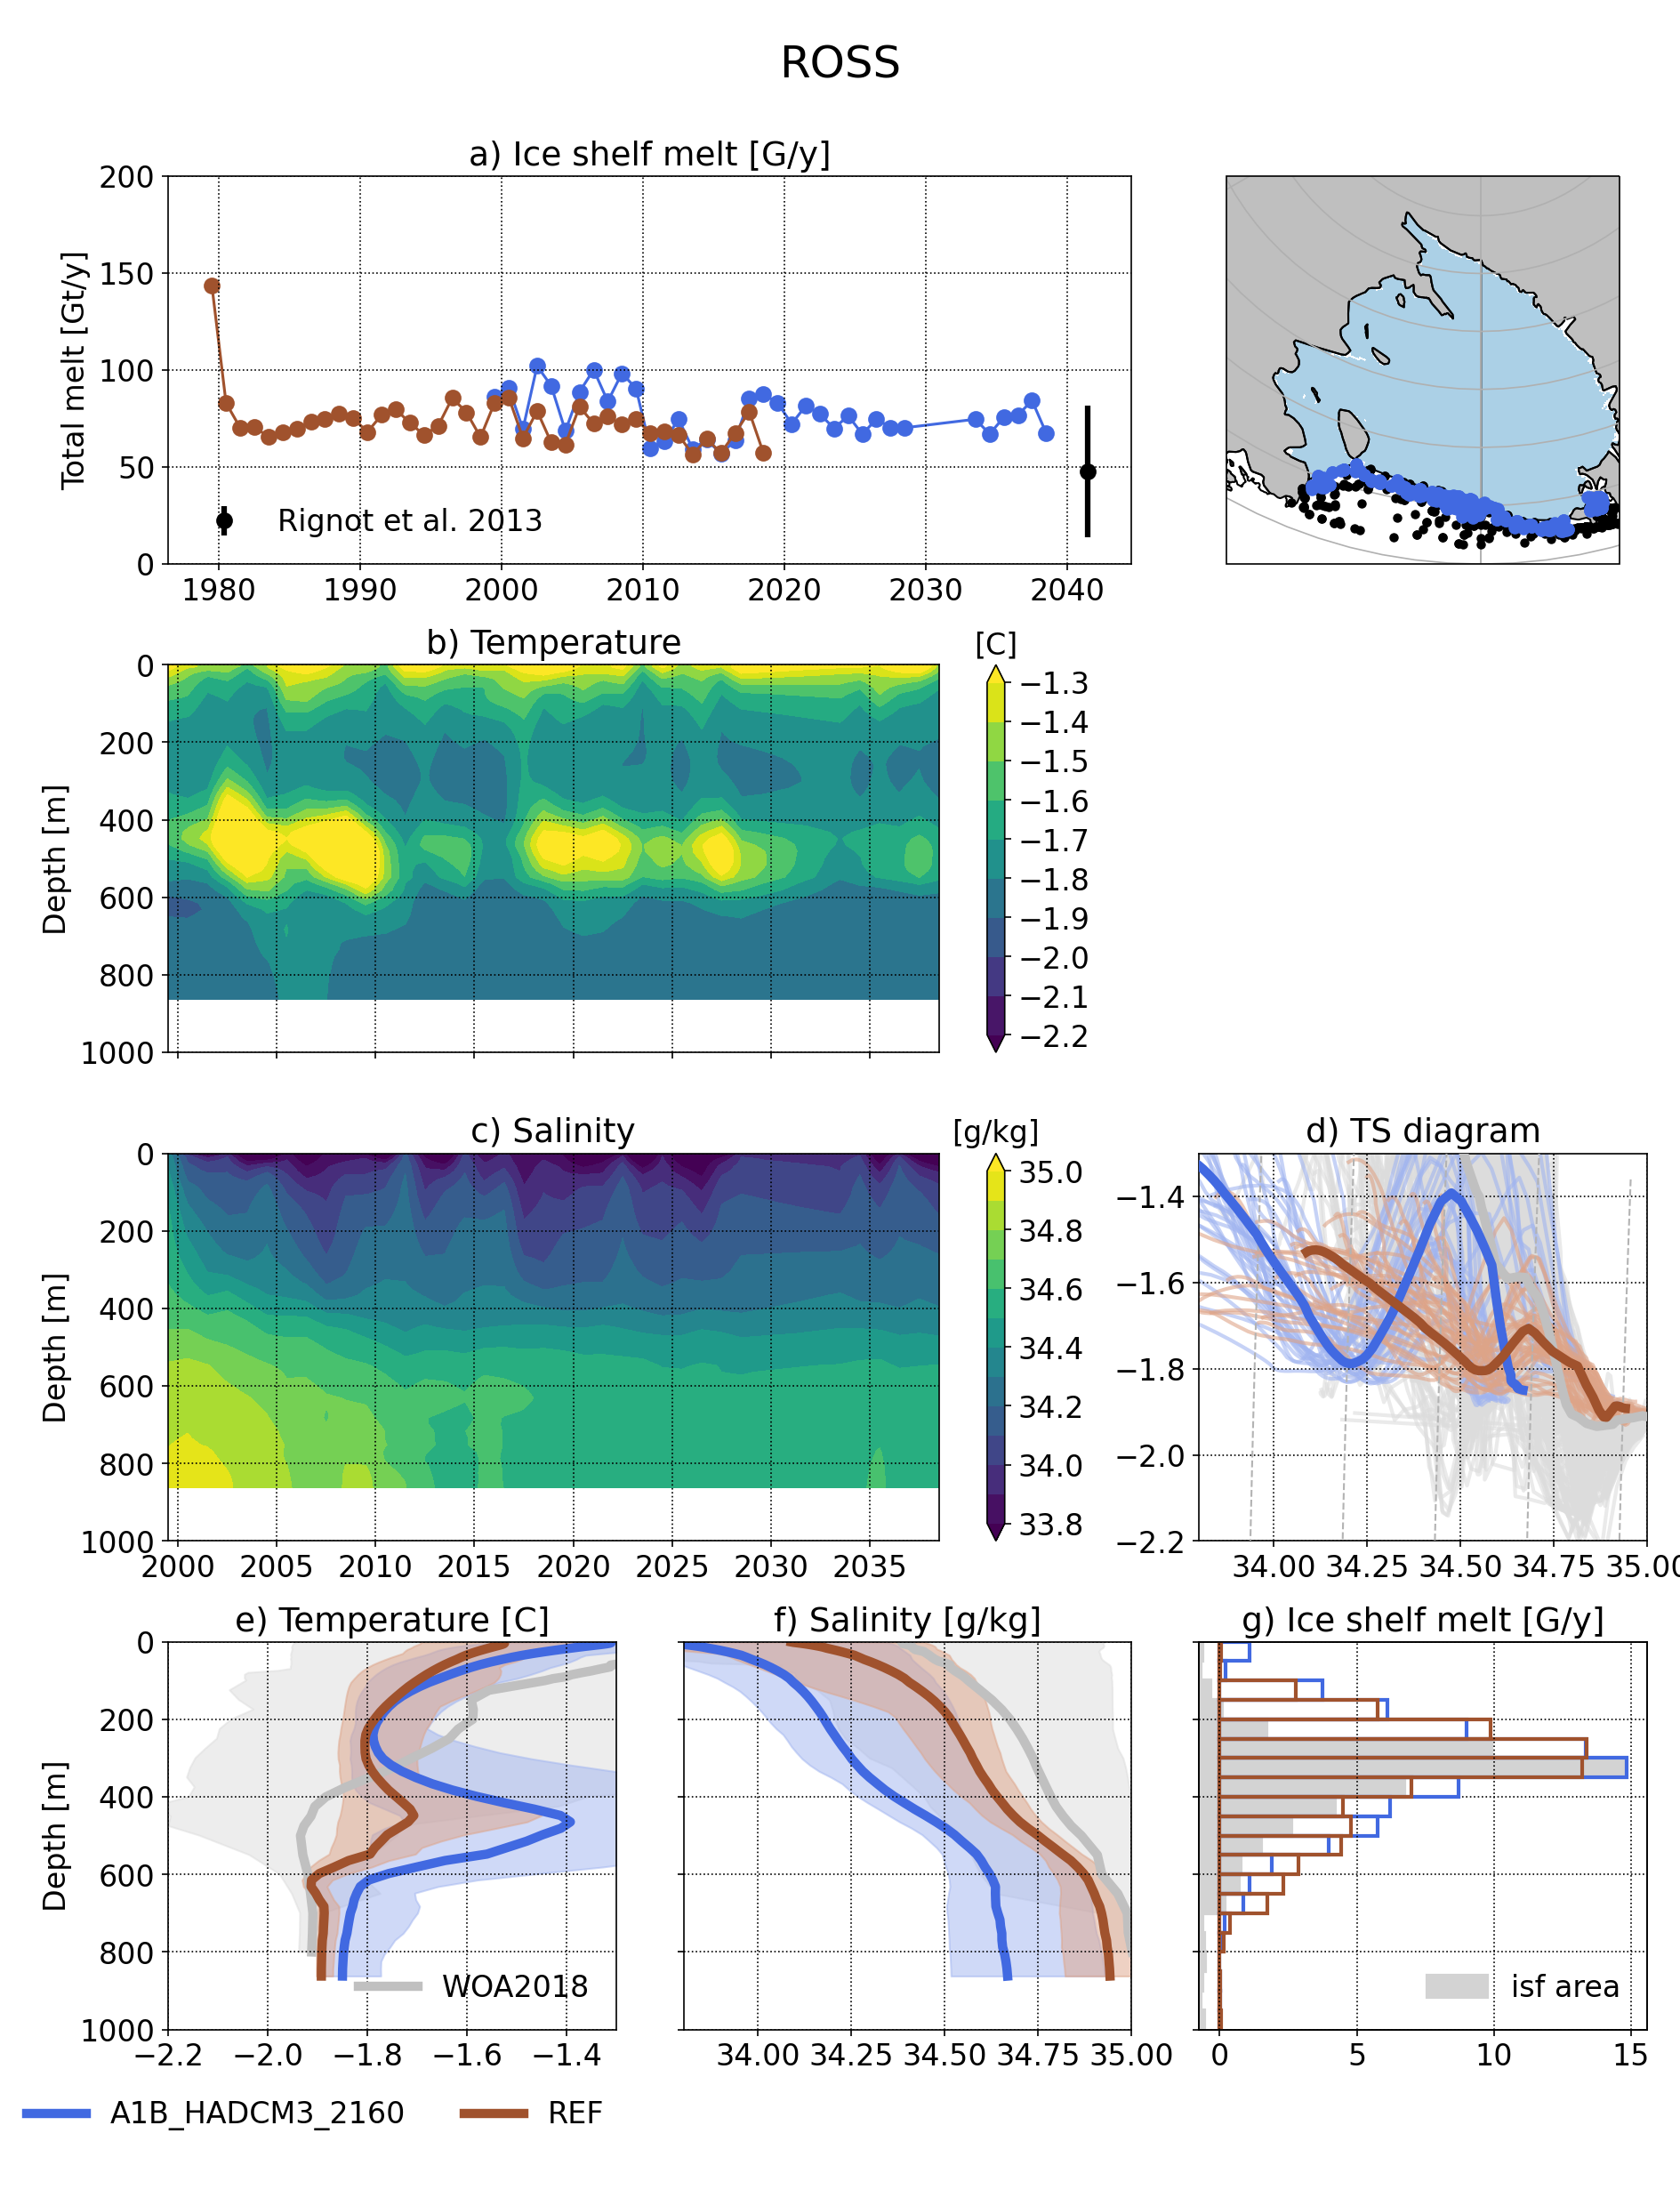
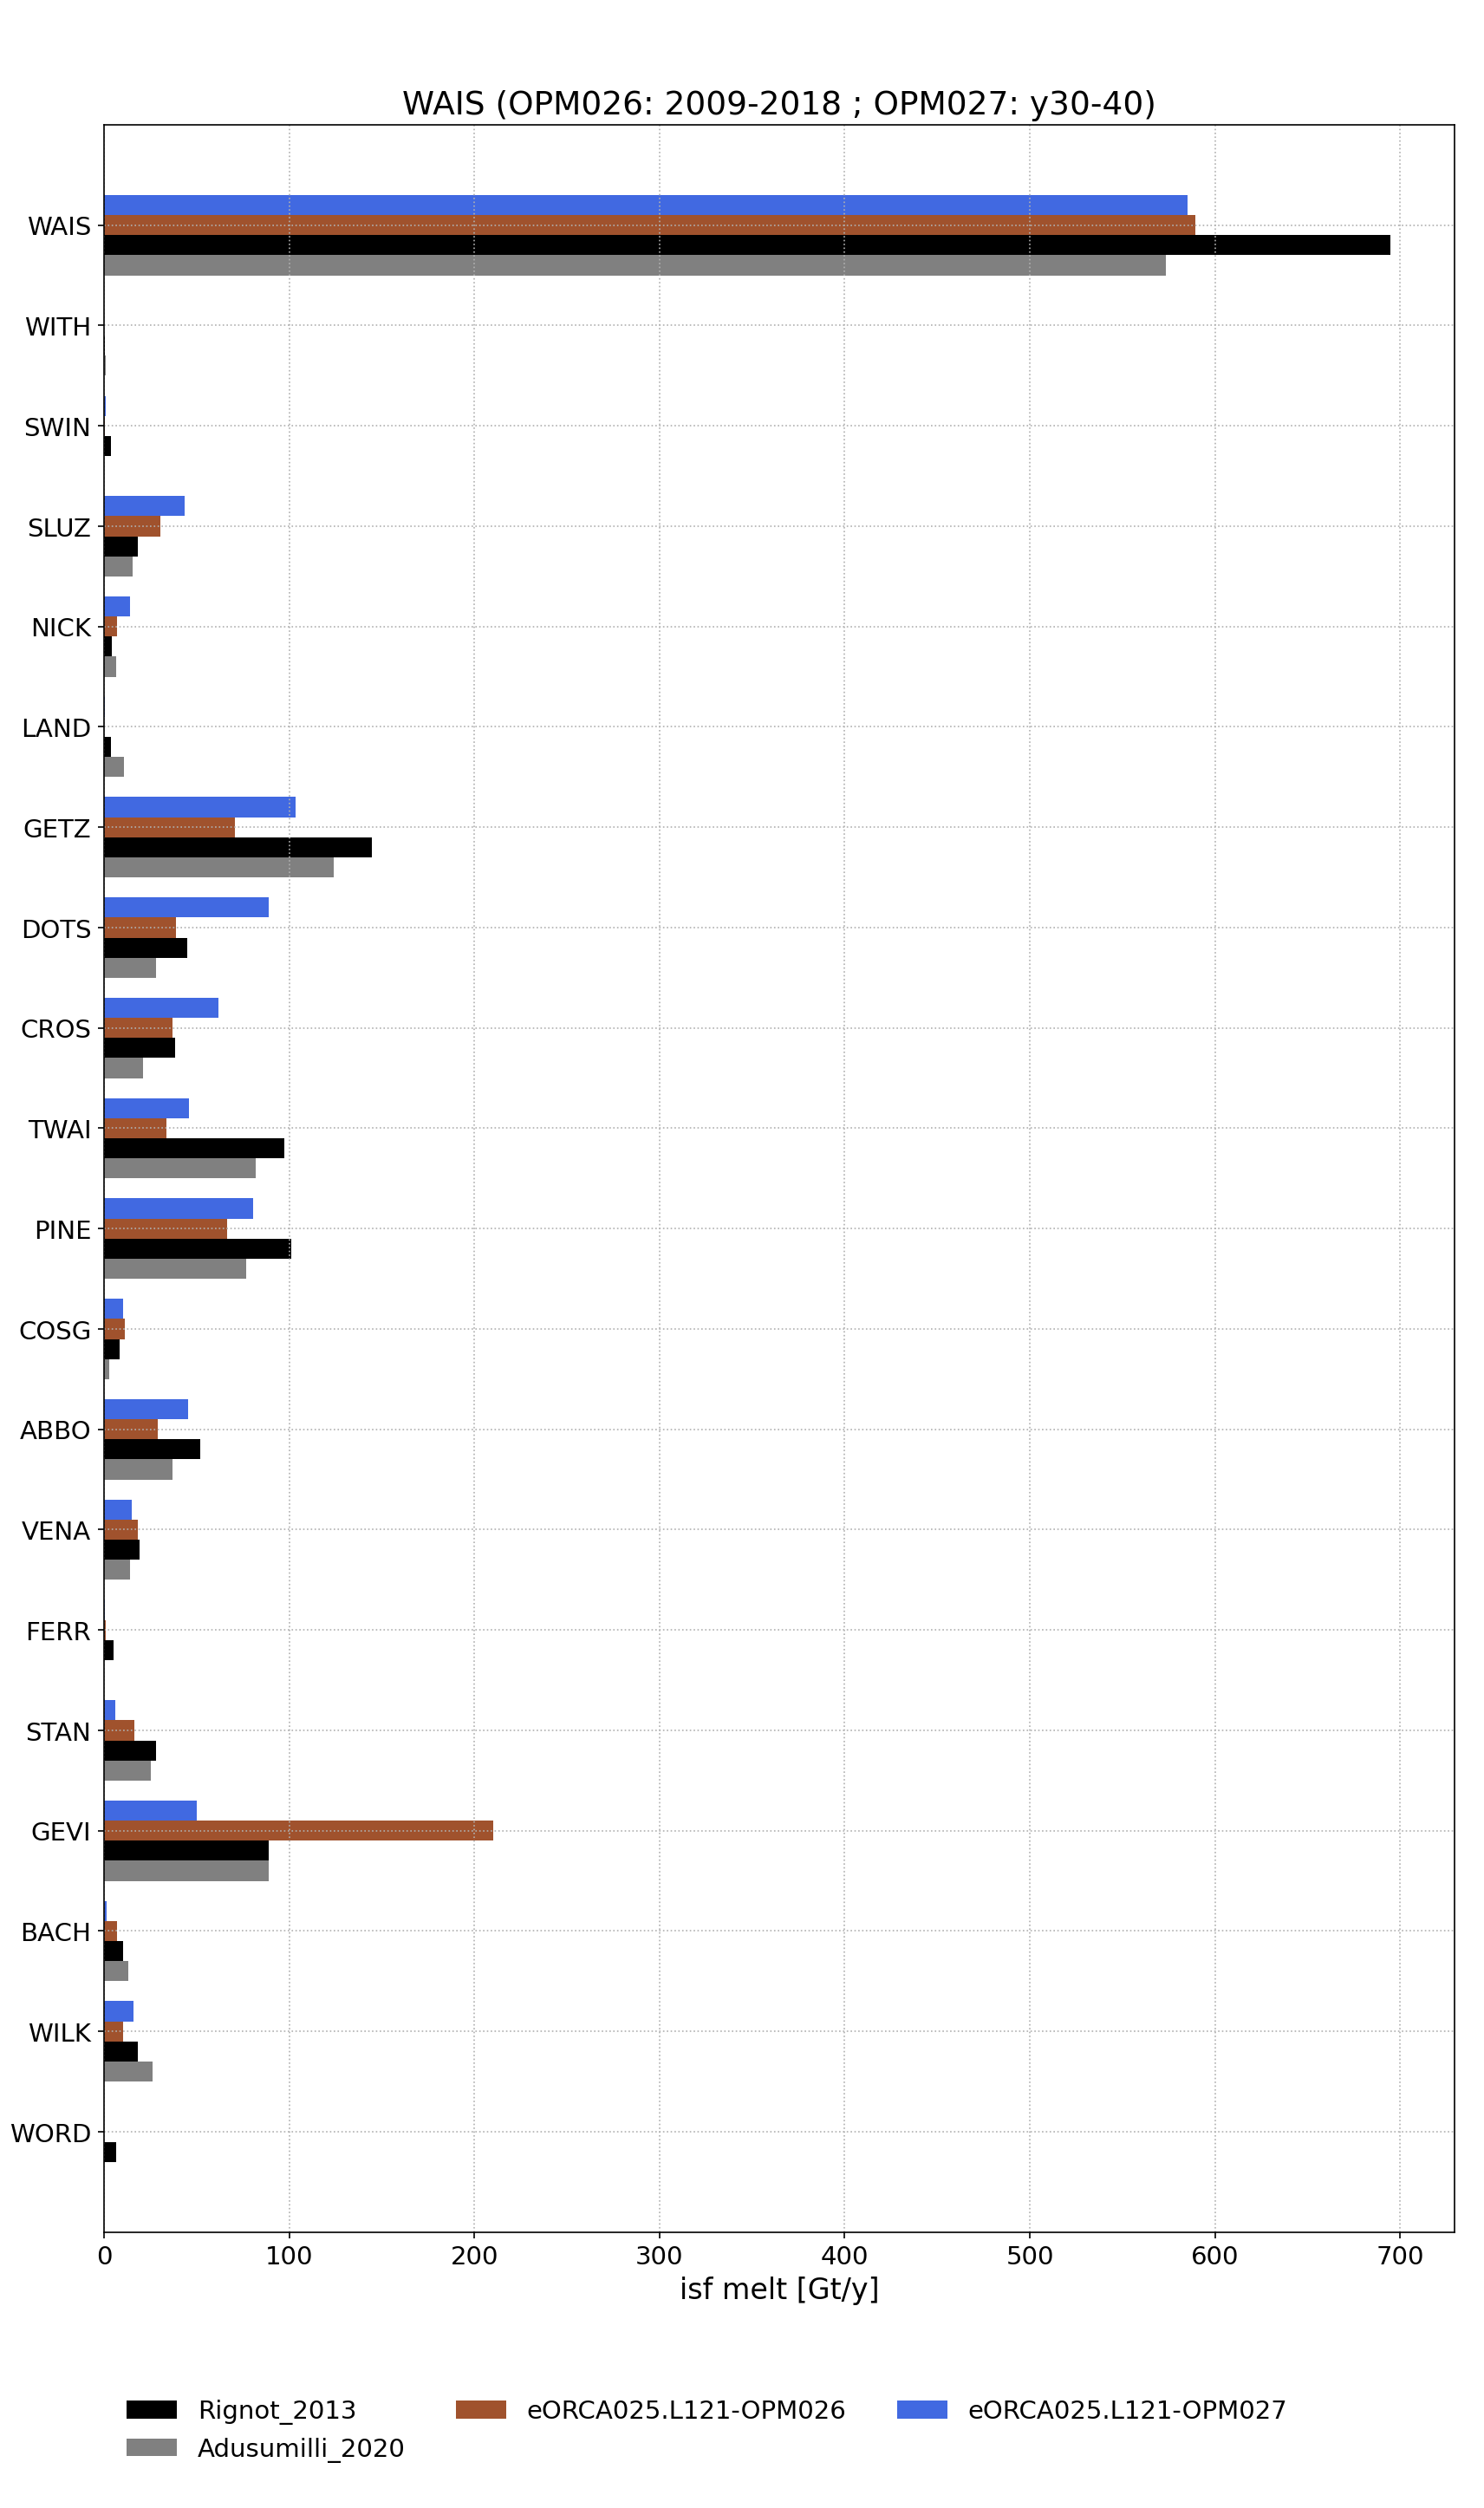
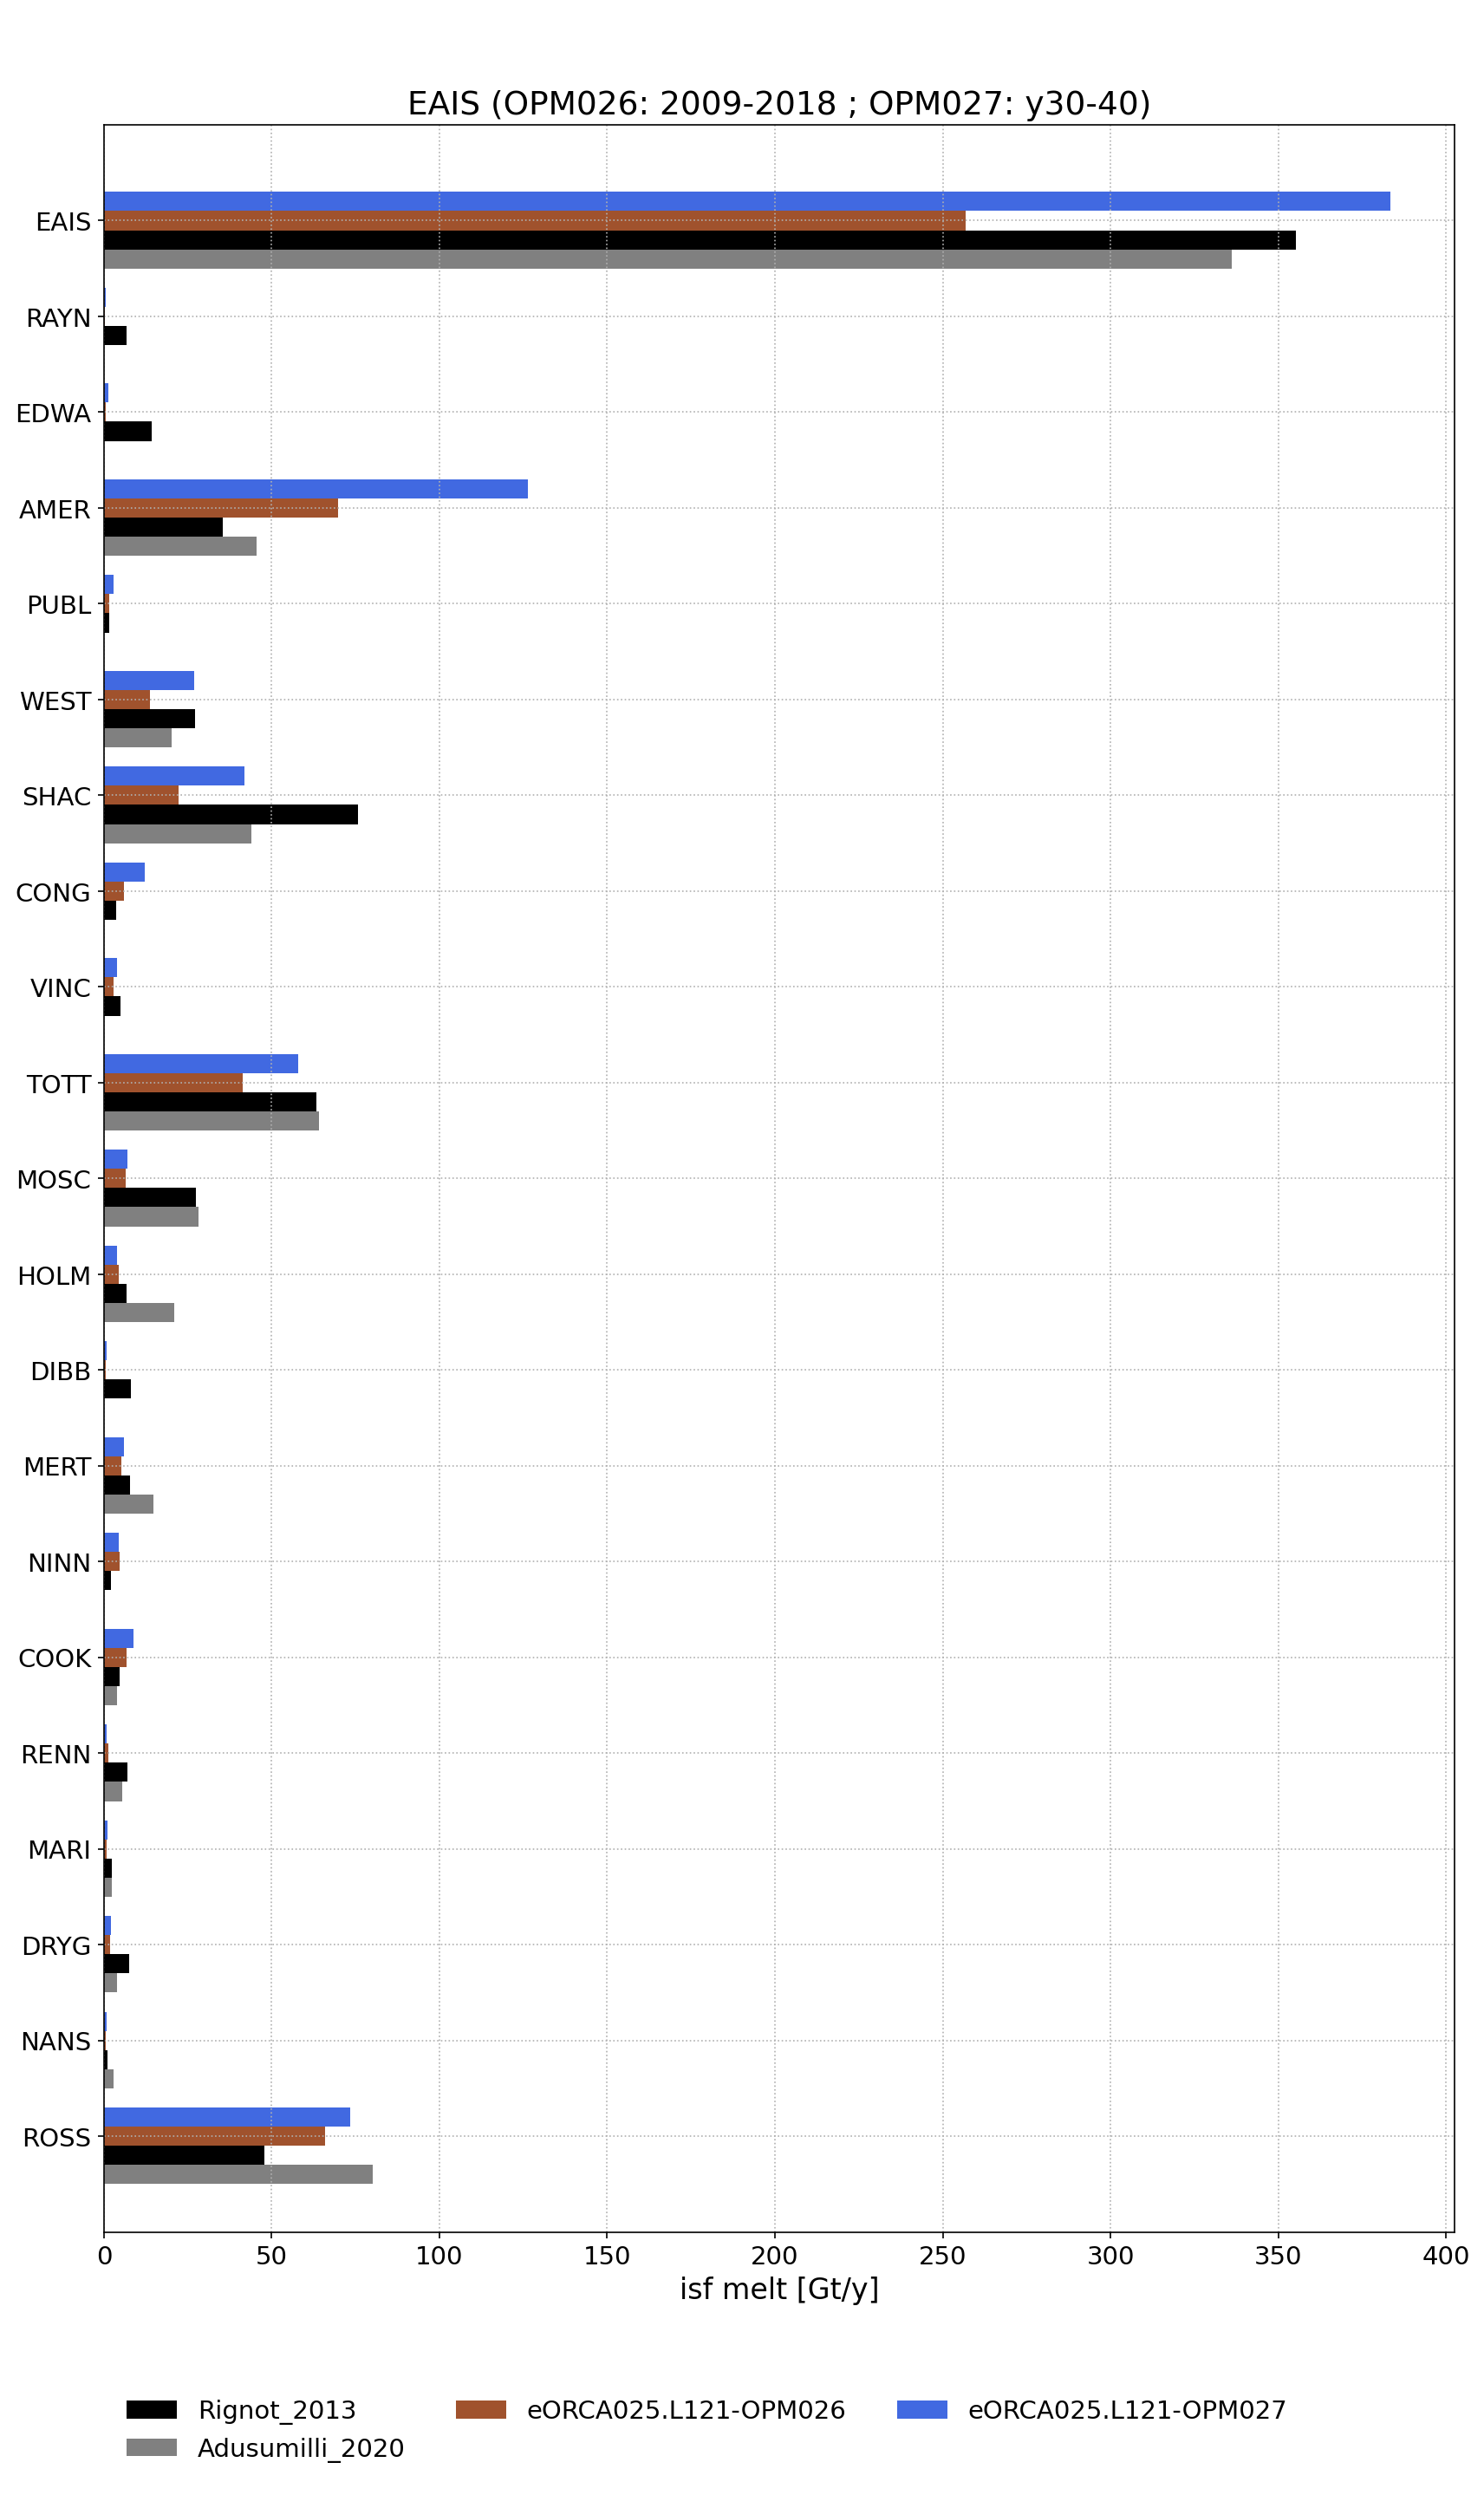
Evaluation
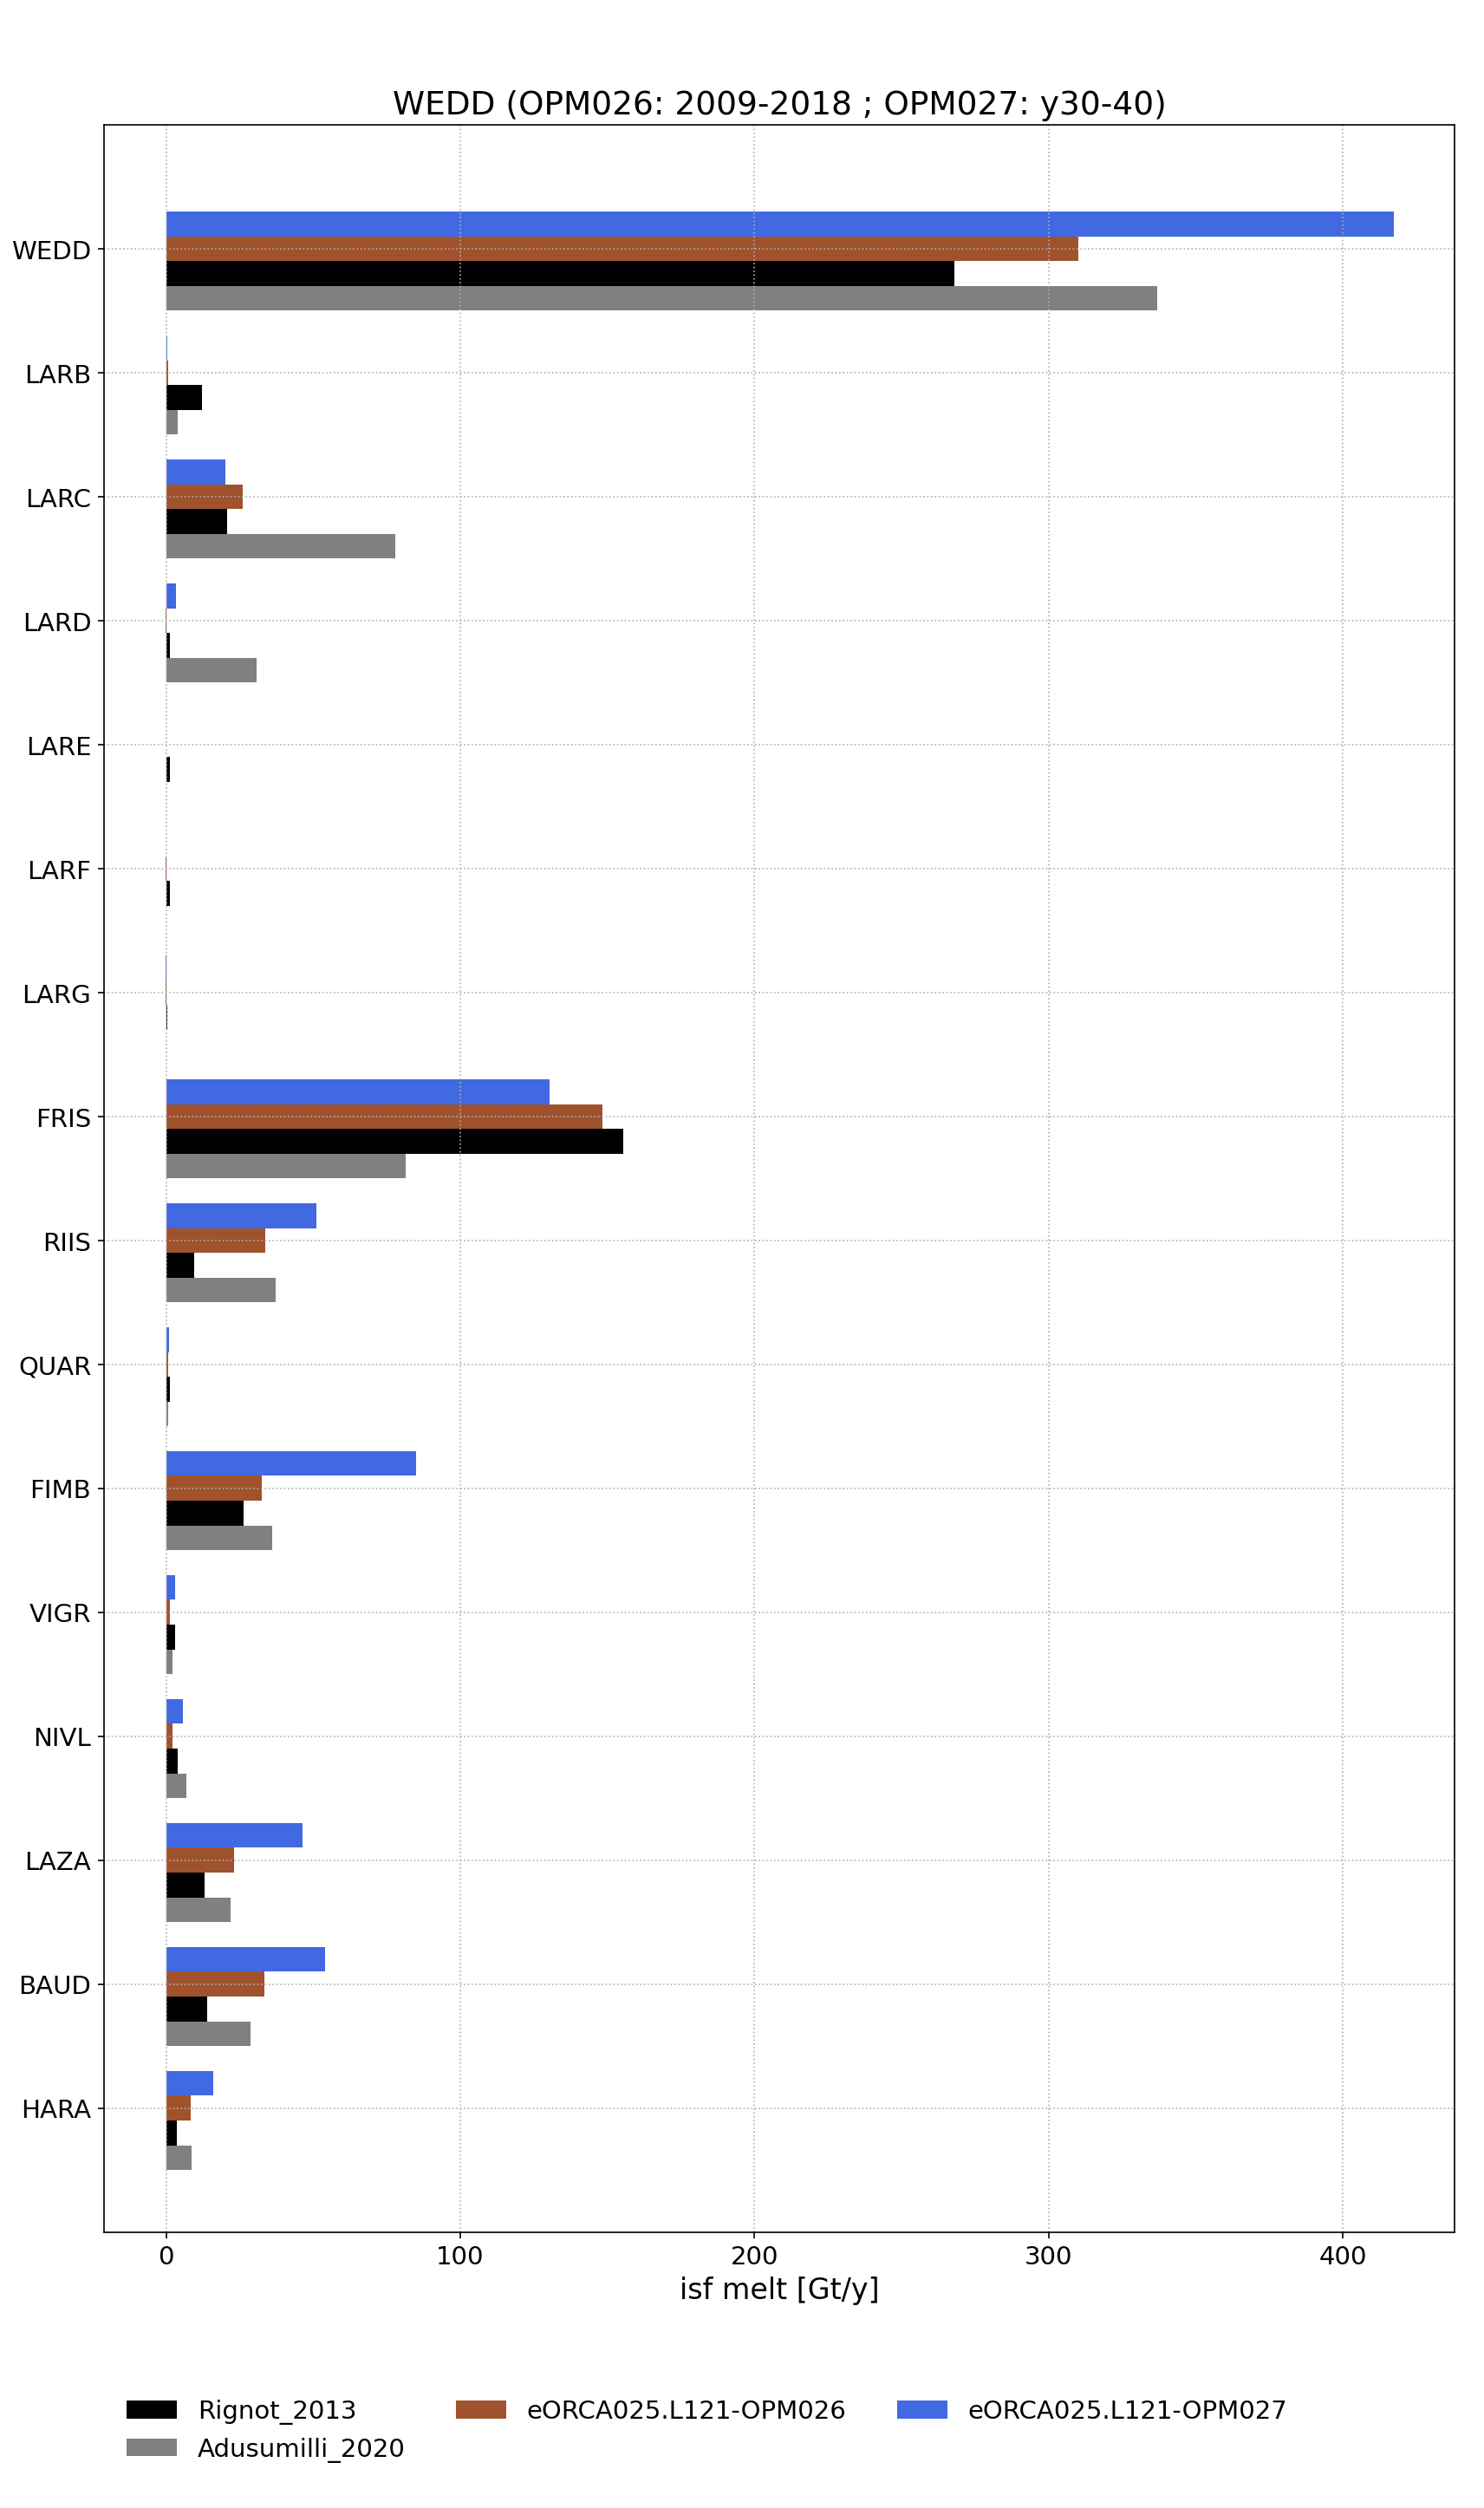
Ice shelf melt: the pictures below are the climatological melt for all the ice shelves in NEMO for the OPM027 (y30-40) and OPM026 (2009-2018) simulations by sectors.
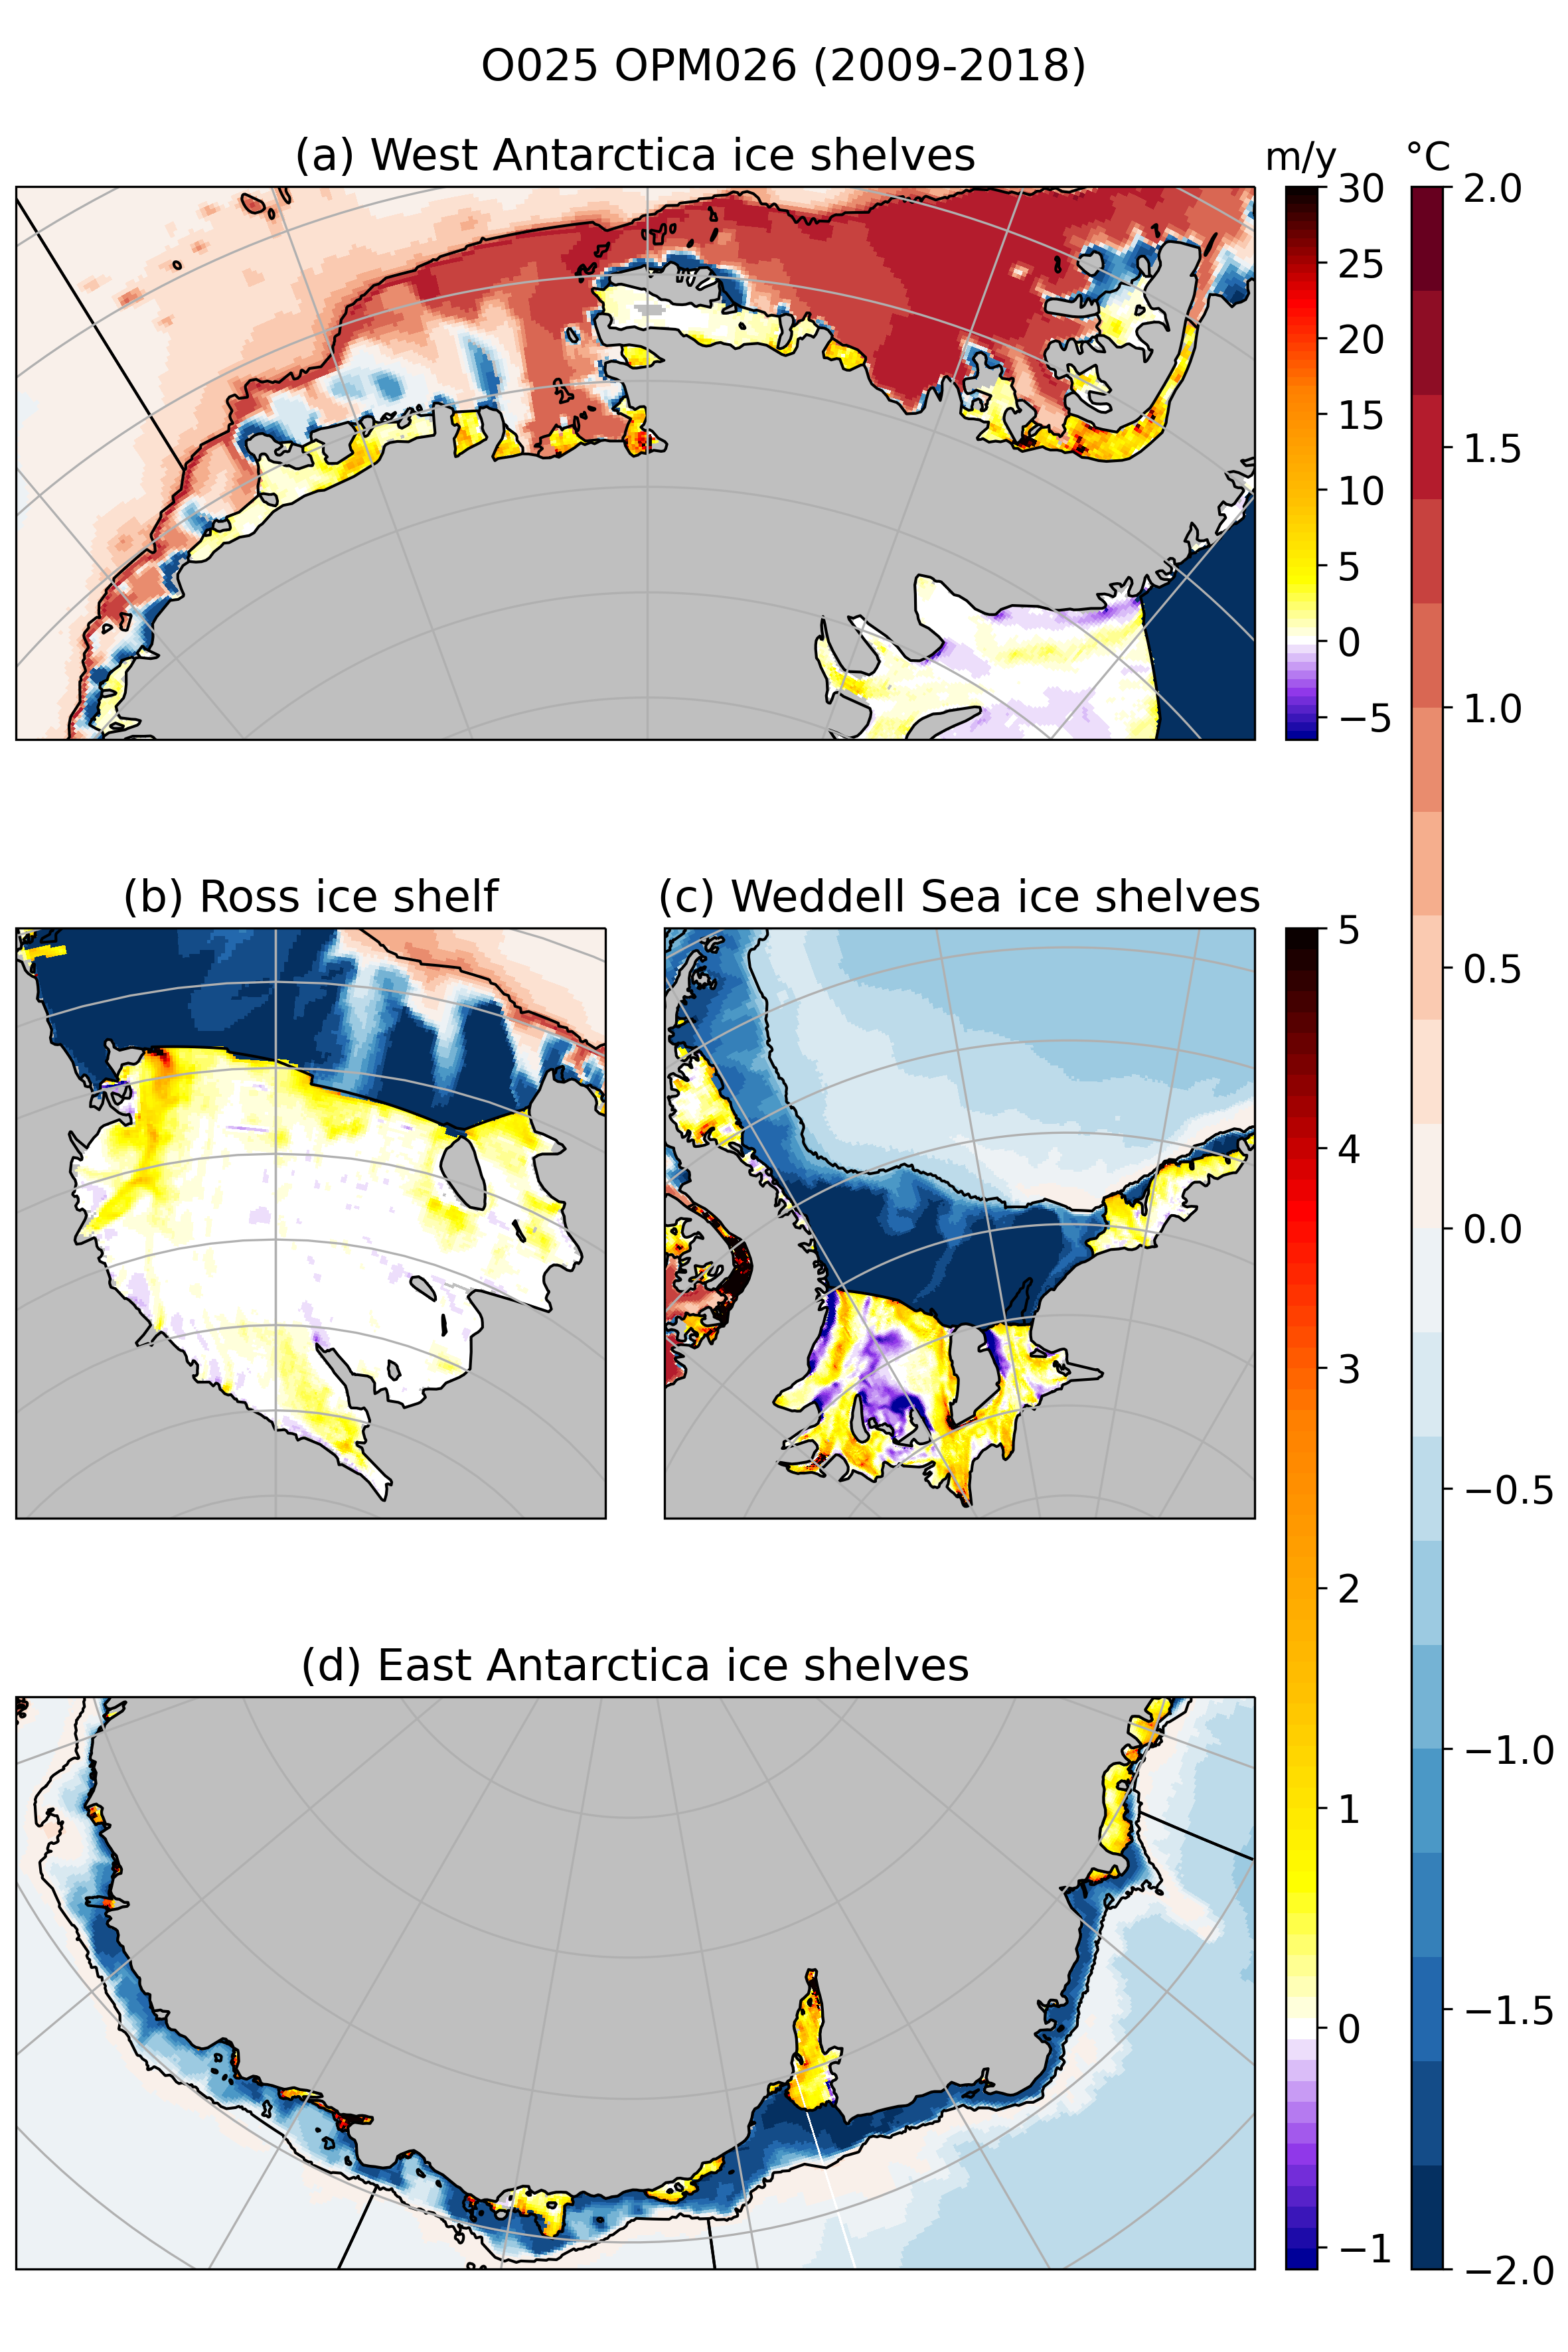
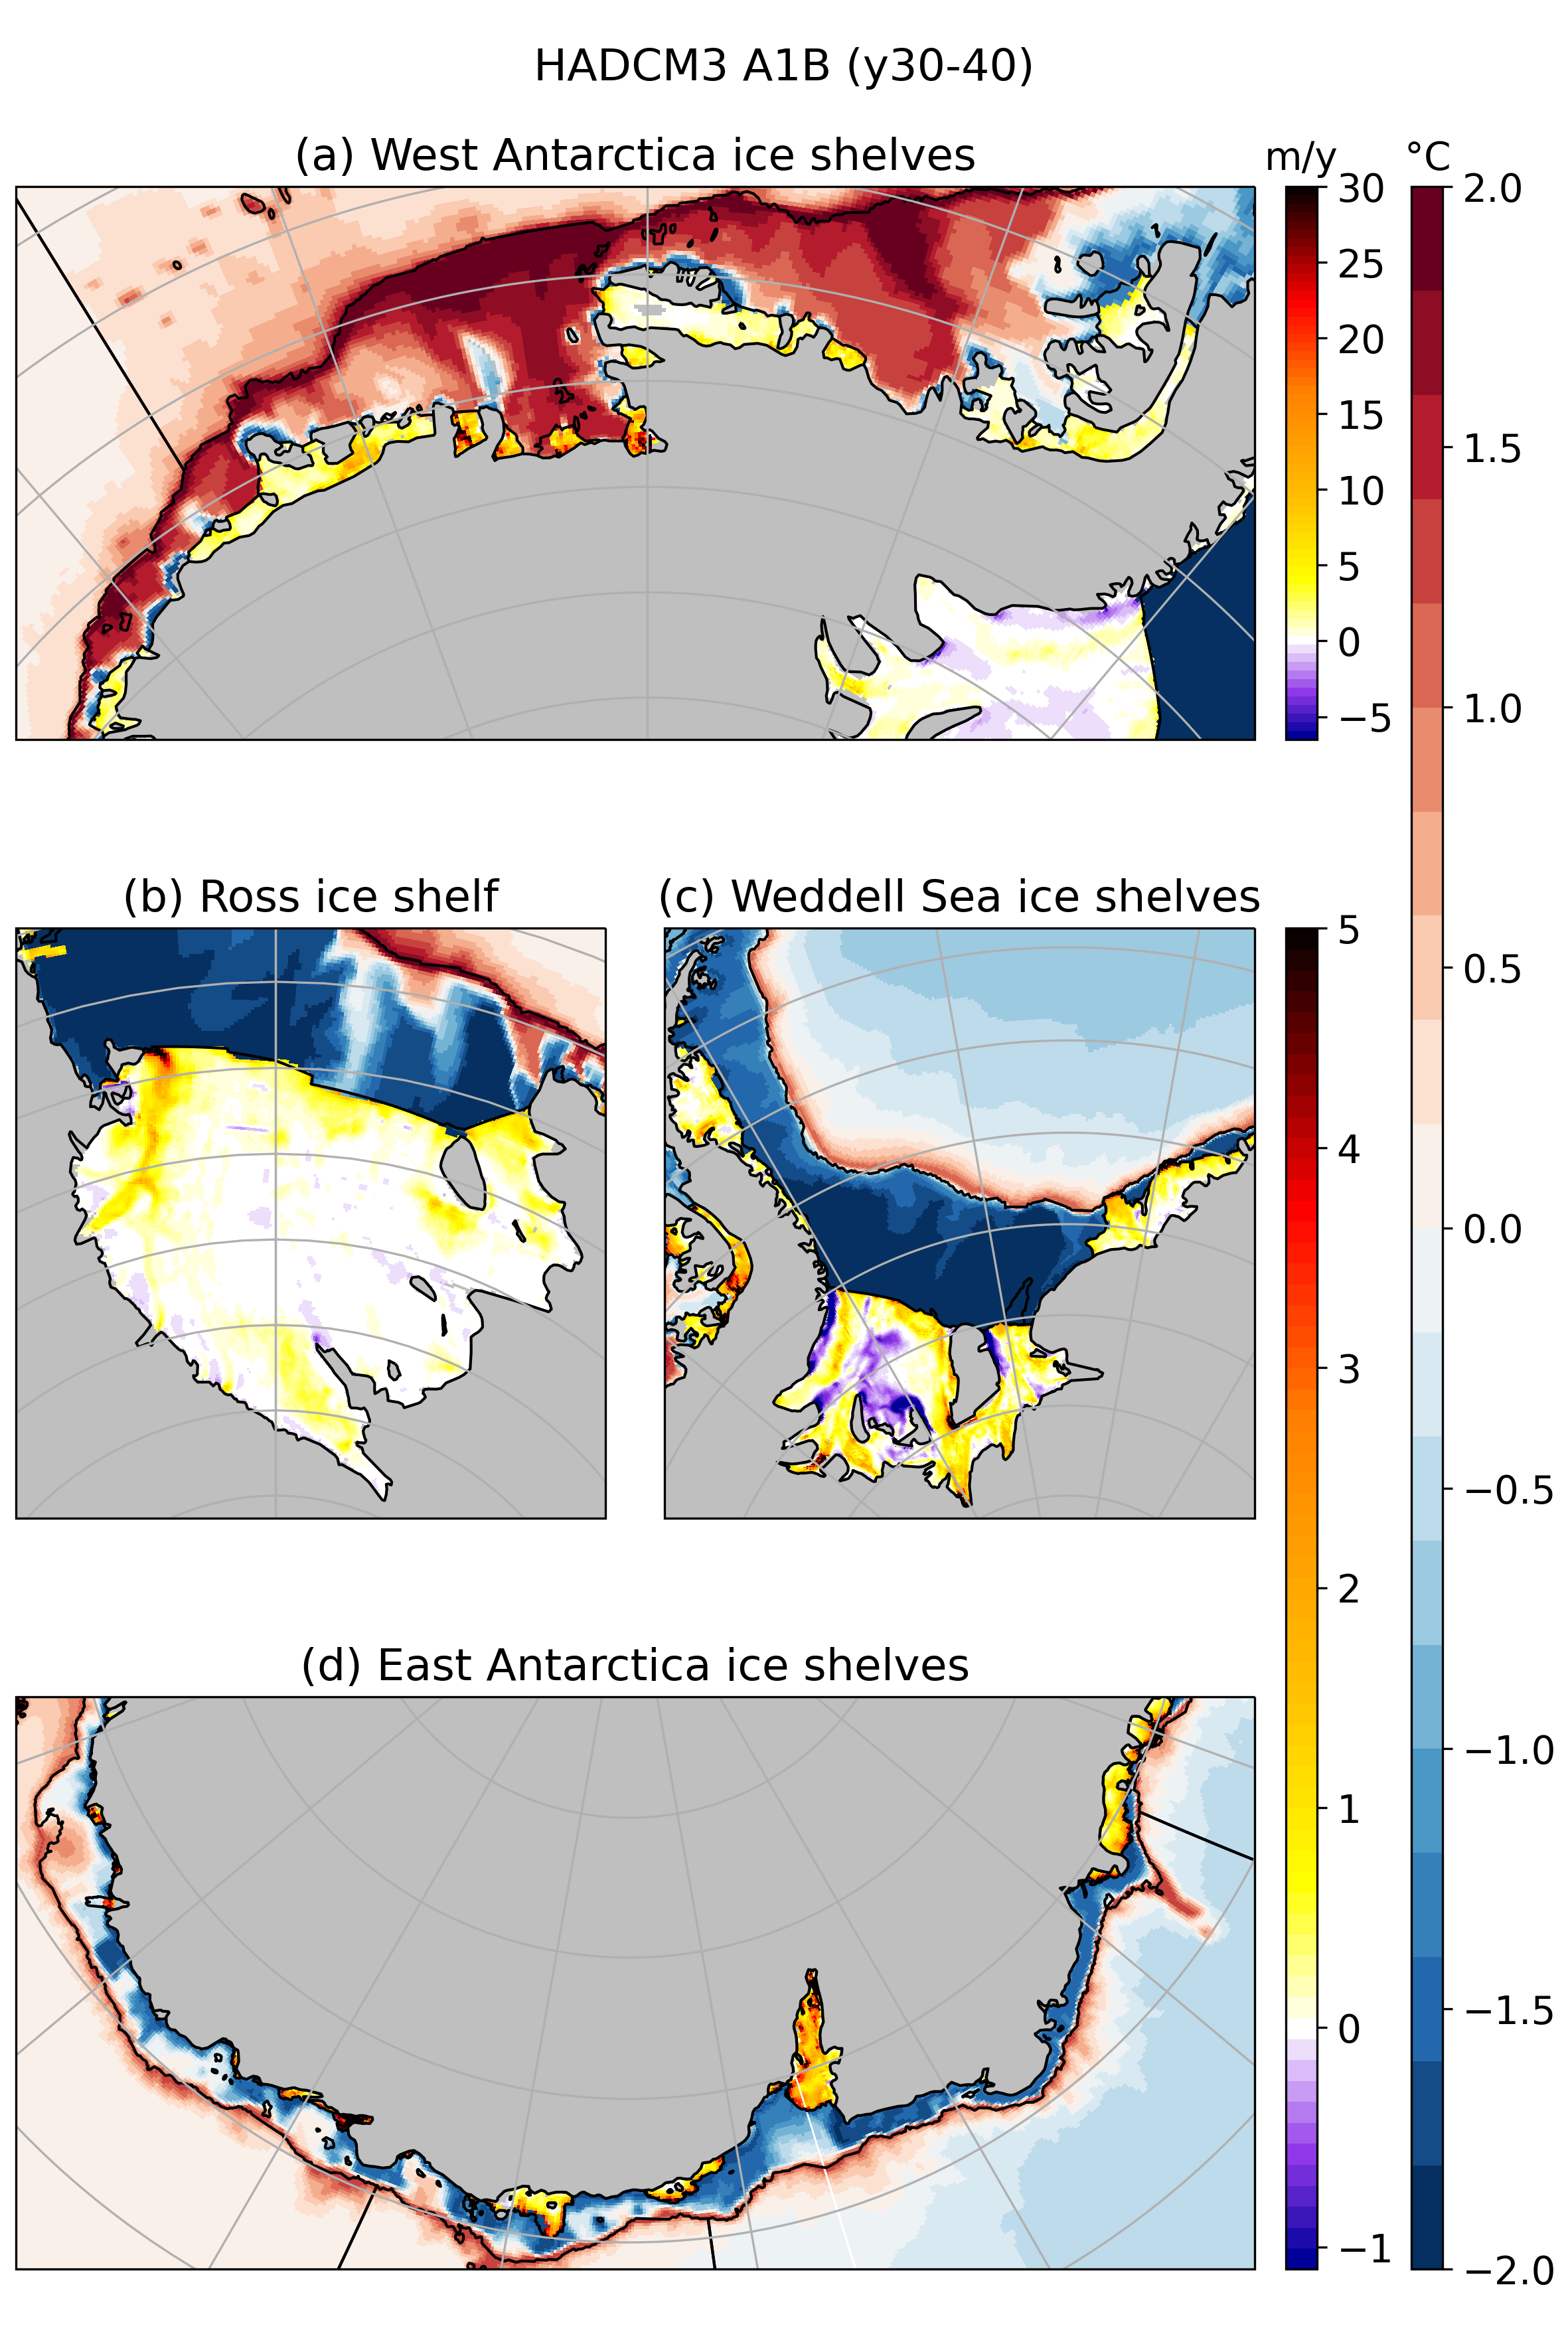
Map of ice shelf melt for both simulations OPM027 (y30-40) and OPM026 (2009-2018) over the last decade of the simulations with bottom temperature.
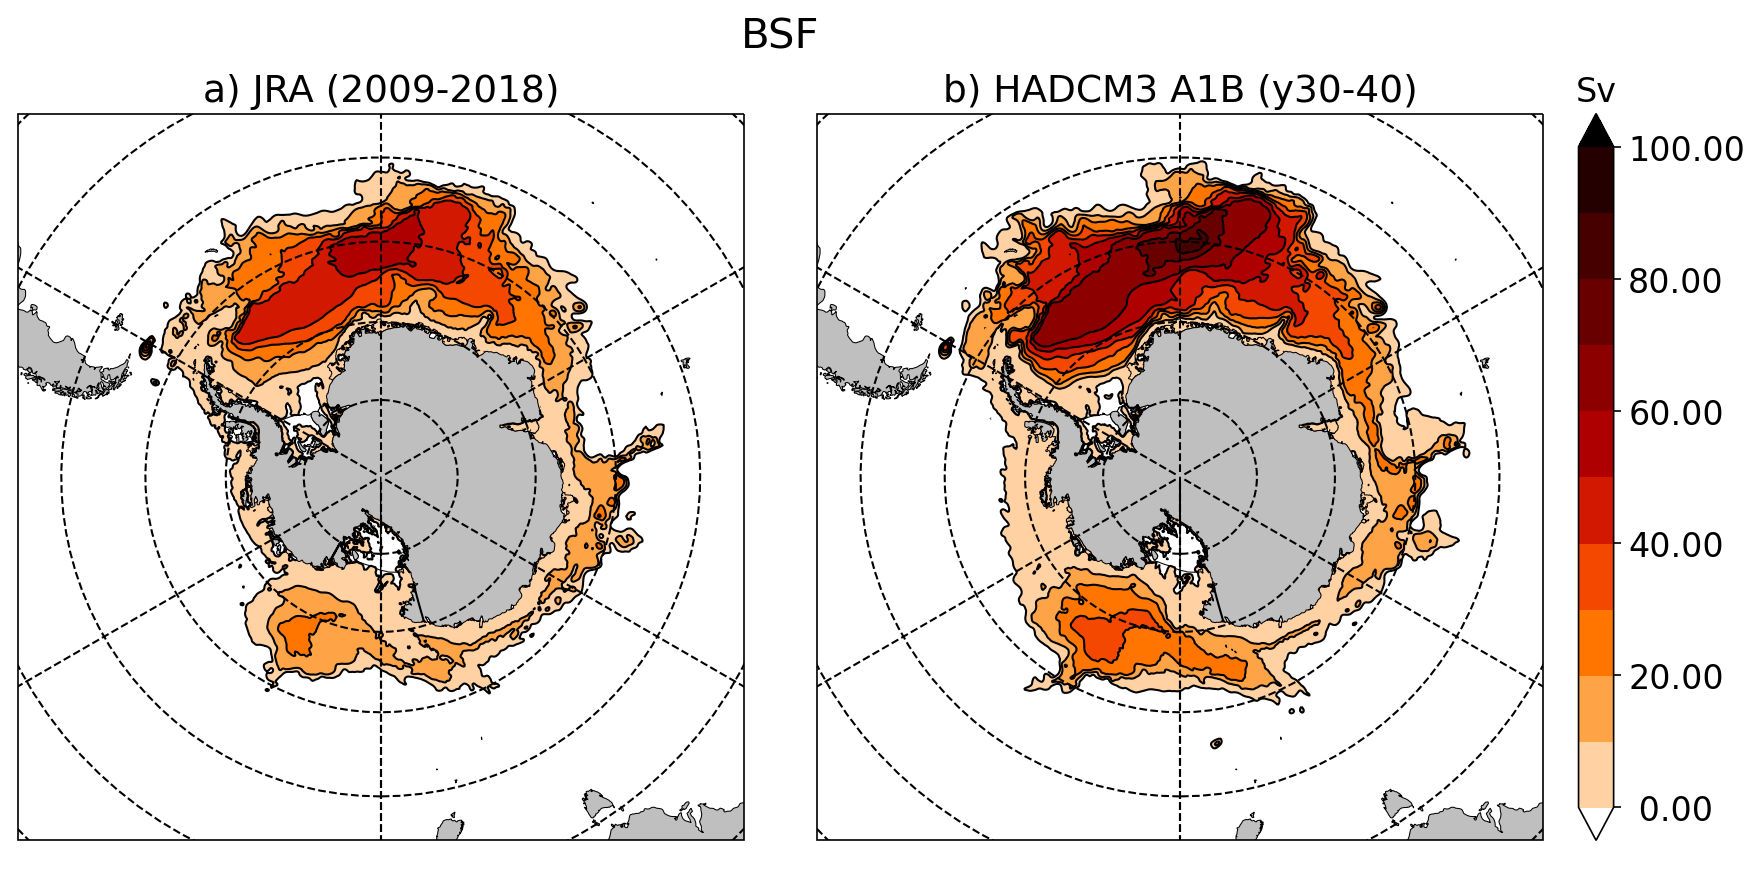
Map of barotropic stream function for both simulations OPM027 (y30-40) and OPM026 (2009-2018).
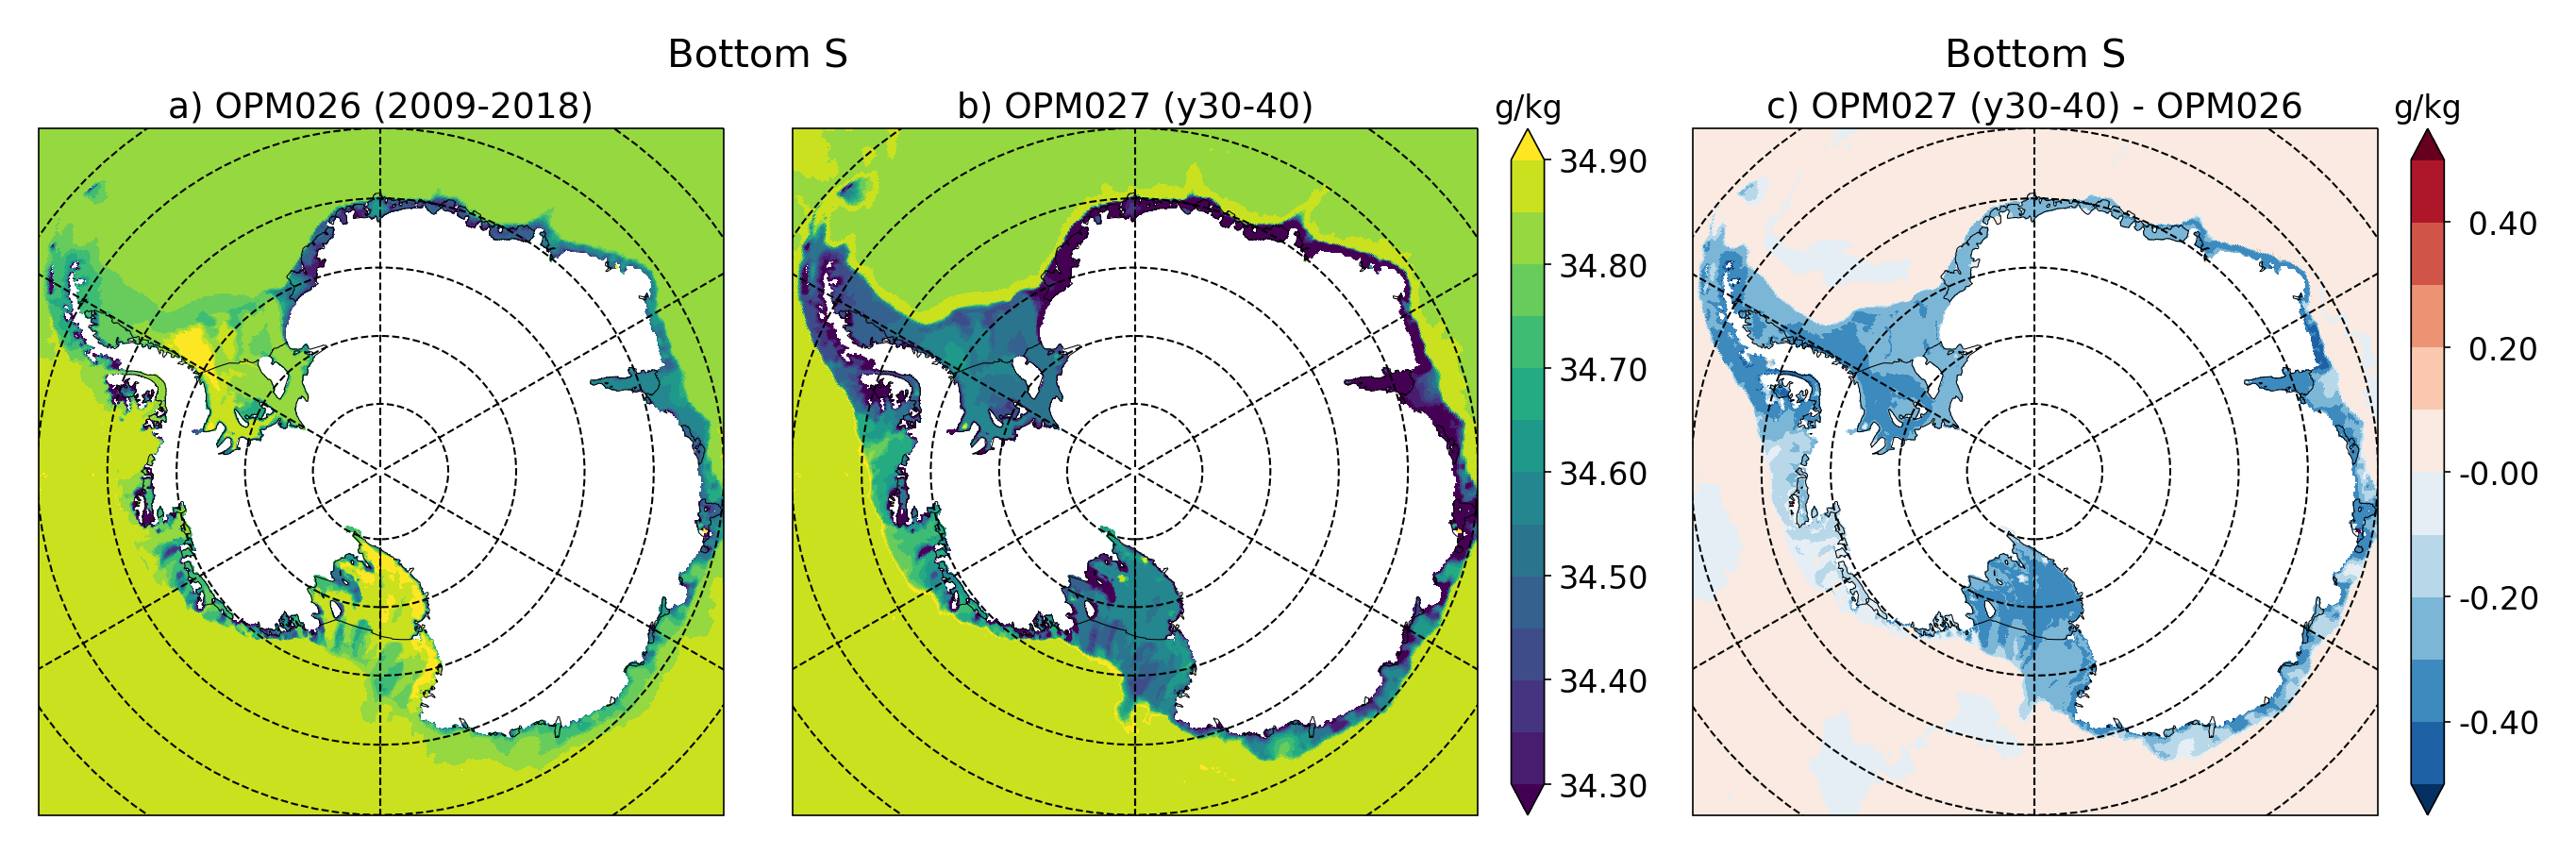
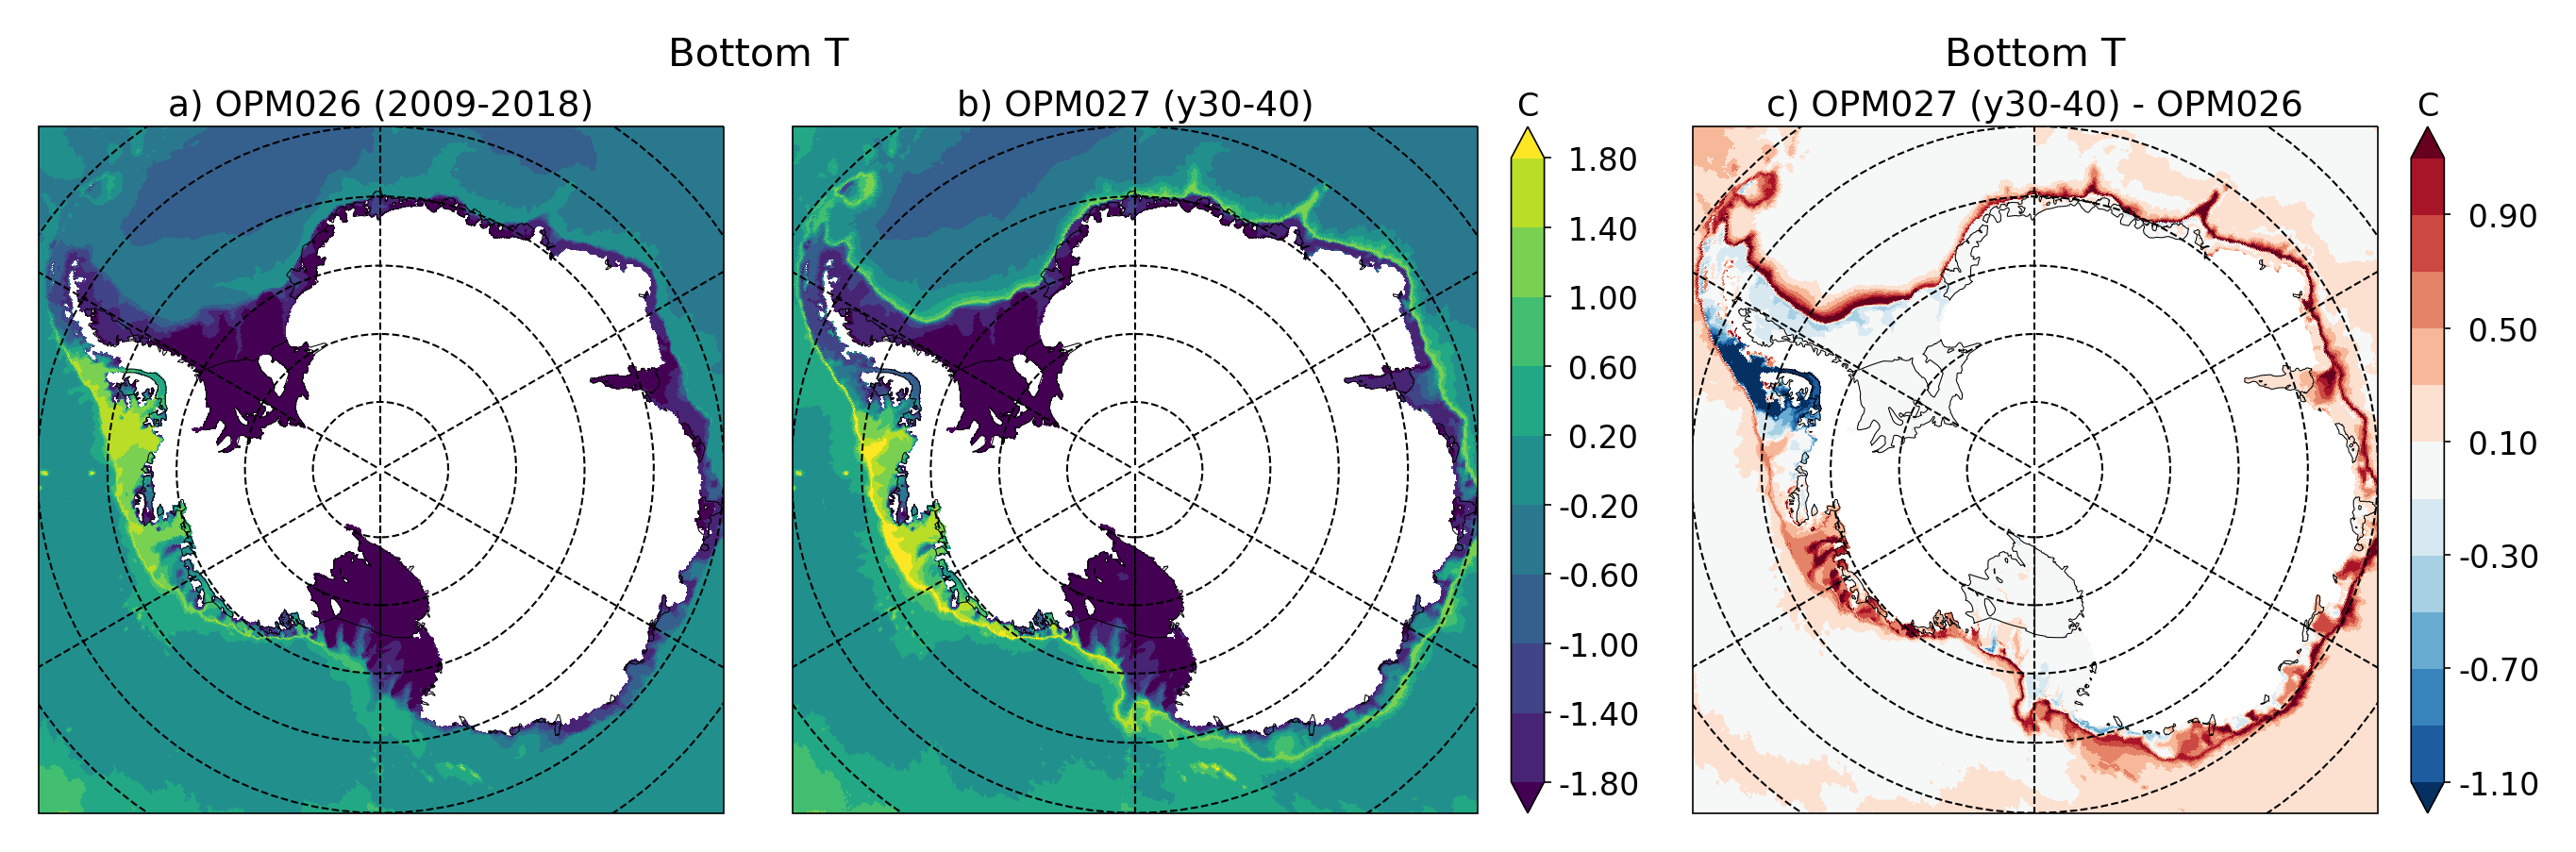
Map of bottomT and bottomS for both simulations OPM027 (y30-40) and OPM026 (2009-2018).